Immigrants from Ecuador vs Belizean Female Poverty
COMPARE
Immigrants from Ecuador
Belizean
Female Poverty
Female Poverty Comparison
Immigrants from Ecuador
Belizeans
15.6%
FEMALE POVERTY
0.1/ 100
METRIC RATING
264th/ 347
METRIC RANK
15.9%
FEMALE POVERTY
0.0/ 100
METRIC RATING
272nd/ 347
METRIC RANK
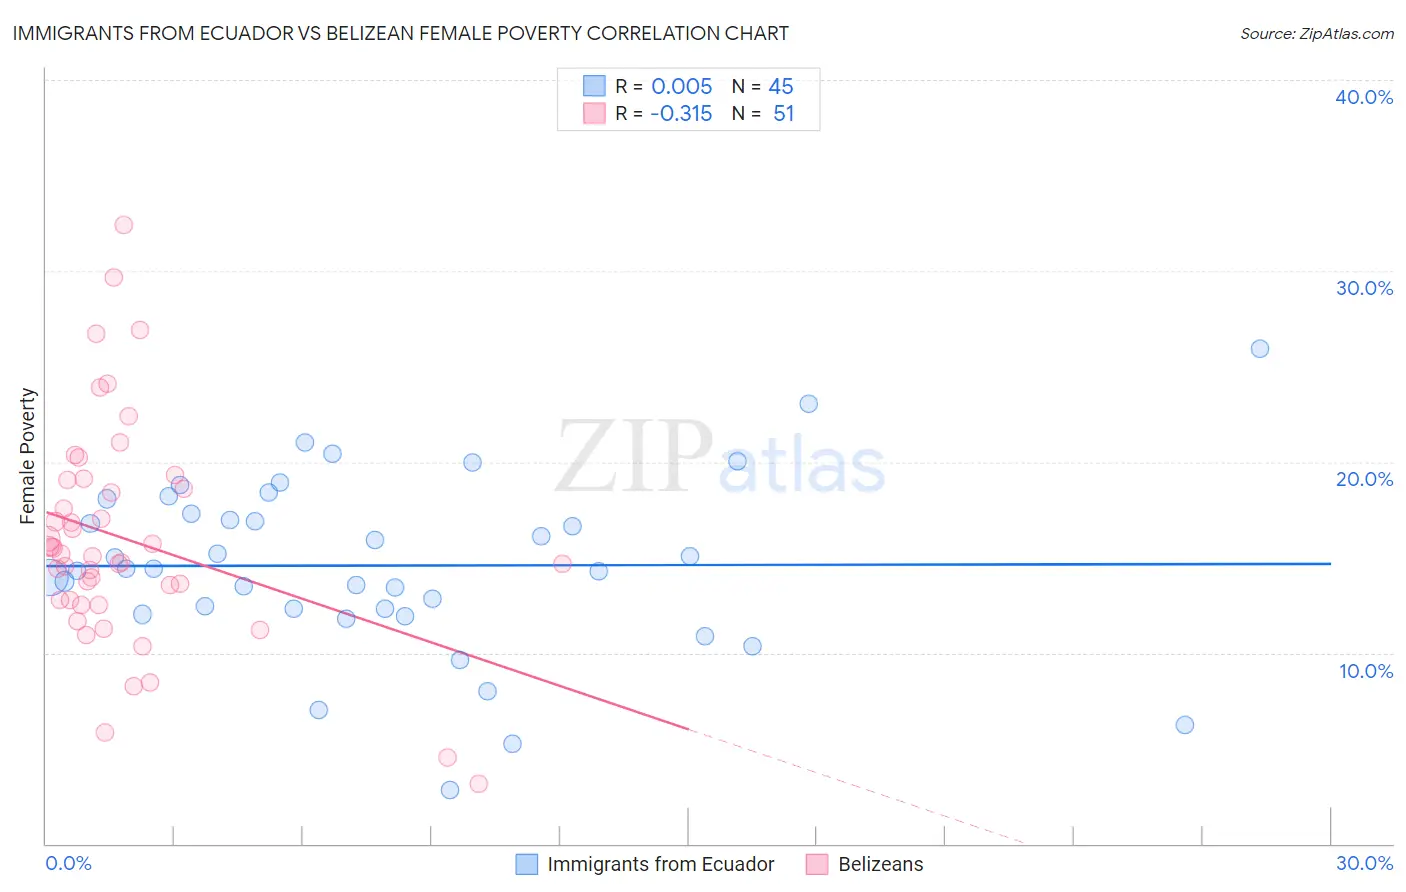
Immigrants from Ecuador vs Belizean Female Poverty Correlation Chart
The statistical analysis conducted on geographies consisting of 270,847,702 people shows no correlation between the proportion of Immigrants from Ecuador and poverty level among females in the United States with a correlation coefficient (R) of 0.005 and weighted average of 15.6%. Similarly, the statistical analysis conducted on geographies consisting of 144,152,301 people shows a mild negative correlation between the proportion of Belizeans and poverty level among females in the United States with a correlation coefficient (R) of -0.315 and weighted average of 15.9%, a difference of 2.0%.
Female Poverty Correlation Summary
| Measurement | Immigrants from Ecuador | Belizean |
| Minimum | 2.8% | 3.2% |
| Maximum | 25.9% | 32.4% |
| Range | 23.1% | 29.2% |
| Mean | 14.6% | 16.0% |
| Median | 14.4% | 15.2% |
| Interquartile 25% (IQ1) | 12.2% | 12.8% |
| Interquartile 75% (IQ3) | 17.7% | 19.1% |
| Interquartile Range (IQR) | 5.5% | 6.3% |
| Standard Deviation (Sample) | 4.6% | 5.8% |
| Standard Deviation (Population) | 4.6% | 5.8% |
Demographics Similar to Immigrants from Ecuador and Belizeans by Female Poverty
In terms of female poverty, the demographic groups most similar to Immigrants from Ecuador are Cherokee (15.6%, a difference of 0.13%), Guyanese (15.6%, a difference of 0.14%), Mexican American Indian (15.6%, a difference of 0.14%), Immigrants from Guyana (15.6%, a difference of 0.24%), and Immigrants from Liberia (15.7%, a difference of 0.30%). Similarly, the demographic groups most similar to Belizeans are Haitian (15.9%, a difference of 0.0%), Barbadian (15.9%, a difference of 0.010%), Immigrants from Barbados (16.0%, a difference of 0.070%), Central American (16.0%, a difference of 0.20%), and Immigrants from St. Vincent and the Grenadines (15.9%, a difference of 0.23%).
| Demographics | Rating | Rank | Female Poverty |
| Shoshone | 0.1 /100 | #258 | Tragic 15.6% |
| Cape Verdeans | 0.1 /100 | #259 | Tragic 15.6% |
| Immigrants | Guyana | 0.1 /100 | #260 | Tragic 15.6% |
| Guyanese | 0.1 /100 | #261 | Tragic 15.6% |
| Mexican American Indians | 0.1 /100 | #262 | Tragic 15.6% |
| Cherokee | 0.1 /100 | #263 | Tragic 15.6% |
| Immigrants | Ecuador | 0.1 /100 | #264 | Tragic 15.6% |
| Immigrants | Liberia | 0.1 /100 | #265 | Tragic 15.7% |
| Immigrants | El Salvador | 0.1 /100 | #266 | Tragic 15.7% |
| Sub-Saharan Africans | 0.1 /100 | #267 | Tragic 15.8% |
| Immigrants | Nicaragua | 0.1 /100 | #268 | Tragic 15.8% |
| Iroquois | 0.1 /100 | #269 | Tragic 15.8% |
| Chickasaw | 0.1 /100 | #270 | Tragic 15.9% |
| Immigrants | St. Vincent and the Grenadines | 0.0 /100 | #271 | Tragic 15.9% |
| Belizeans | 0.0 /100 | #272 | Tragic 15.9% |
| Haitians | 0.0 /100 | #273 | Tragic 15.9% |
| Barbadians | 0.0 /100 | #274 | Tragic 15.9% |
| Immigrants | Barbados | 0.0 /100 | #275 | Tragic 16.0% |
| Central Americans | 0.0 /100 | #276 | Tragic 16.0% |
| Bangladeshis | 0.0 /100 | #277 | Tragic 16.0% |
| Immigrants | West Indies | 0.0 /100 | #278 | Tragic 16.1% |