Arab vs Bahamian Female Poverty
COMPARE
Arab
Bahamian
Female Poverty
Female Poverty Comparison
Arabs
Bahamians
13.7%
FEMALE POVERTY
28.6/ 100
METRIC RATING
197th/ 347
METRIC RANK
16.6%
FEMALE POVERTY
0.0/ 100
METRIC RATING
300th/ 347
METRIC RANK
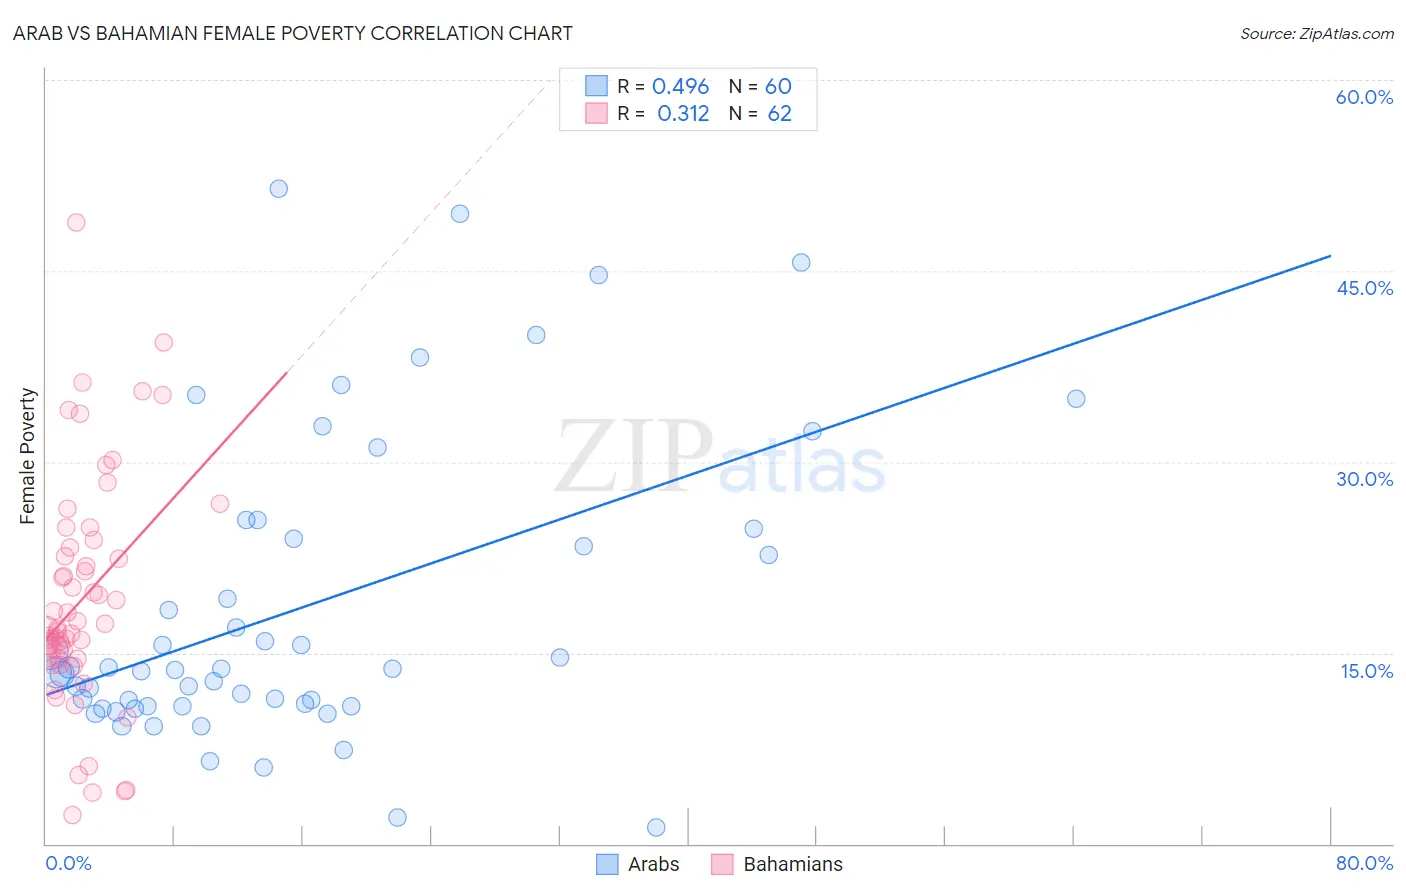
Arab vs Bahamian Female Poverty Correlation Chart
The statistical analysis conducted on geographies consisting of 486,246,115 people shows a moderate positive correlation between the proportion of Arabs and poverty level among females in the United States with a correlation coefficient (R) of 0.496 and weighted average of 13.7%. Similarly, the statistical analysis conducted on geographies consisting of 112,629,599 people shows a mild positive correlation between the proportion of Bahamians and poverty level among females in the United States with a correlation coefficient (R) of 0.312 and weighted average of 16.6%, a difference of 21.2%.
Female Poverty Correlation Summary
| Measurement | Arab | Bahamian |
| Minimum | 1.3% | 2.3% |
| Maximum | 51.5% | 48.8% |
| Range | 50.2% | 46.5% |
| Mean | 18.5% | 19.2% |
| Median | 13.7% | 16.9% |
| Interquartile 25% (IQ1) | 10.8% | 14.6% |
| Interquartile 75% (IQ3) | 24.3% | 23.2% |
| Interquartile Range (IQR) | 13.5% | 8.7% |
| Standard Deviation (Sample) | 11.9% | 9.1% |
| Standard Deviation (Population) | 11.8% | 9.0% |
Similar Demographics by Female Poverty
Demographics Similar to Arabs by Female Poverty
In terms of female poverty, the demographic groups most similar to Arabs are Immigrants from Uganda (13.7%, a difference of 0.010%), South American Indian (13.7%, a difference of 0.040%), Immigrants from South America (13.7%, a difference of 0.23%), Delaware (13.7%, a difference of 0.29%), and Immigrants from Lebanon (13.8%, a difference of 0.35%).
| Demographics | Rating | Rank | Female Poverty |
| Sierra Leoneans | 33.1 /100 | #190 | Fair 13.7% |
| Immigrants | Kuwait | 32.7 /100 | #191 | Fair 13.7% |
| Immigrants | Costa Rica | 31.9 /100 | #192 | Fair 13.7% |
| Iraqis | 31.8 /100 | #193 | Fair 13.7% |
| Delaware | 31.1 /100 | #194 | Fair 13.7% |
| Immigrants | South America | 30.6 /100 | #195 | Fair 13.7% |
| South American Indians | 28.9 /100 | #196 | Fair 13.7% |
| Arabs | 28.6 /100 | #197 | Fair 13.7% |
| Immigrants | Uganda | 28.5 /100 | #198 | Fair 13.7% |
| Immigrants | Lebanon | 25.6 /100 | #199 | Fair 13.8% |
| Spanish | 21.4 /100 | #200 | Fair 13.9% |
| Immigrants | Kenya | 21.1 /100 | #201 | Fair 13.9% |
| Hmong | 21.1 /100 | #202 | Fair 13.9% |
| Immigrants | Western Asia | 20.7 /100 | #203 | Fair 13.9% |
| Spaniards | 18.9 /100 | #204 | Poor 13.9% |
Demographics Similar to Bahamians by Female Poverty
In terms of female poverty, the demographic groups most similar to Bahamians are Hispanic or Latino (16.6%, a difference of 0.040%), Guatemalan (16.7%, a difference of 0.33%), Chippewa (16.7%, a difference of 0.36%), Somali (16.6%, a difference of 0.56%), and Mexican (16.5%, a difference of 0.77%).
| Demographics | Rating | Rank | Female Poverty |
| Immigrants | Latin America | 0.0 /100 | #293 | Tragic 16.4% |
| Immigrants | Cabo Verde | 0.0 /100 | #294 | Tragic 16.4% |
| Senegalese | 0.0 /100 | #295 | Tragic 16.5% |
| Immigrants | Senegal | 0.0 /100 | #296 | Tragic 16.5% |
| Mexicans | 0.0 /100 | #297 | Tragic 16.5% |
| Somalis | 0.0 /100 | #298 | Tragic 16.6% |
| Hispanics or Latinos | 0.0 /100 | #299 | Tragic 16.6% |
| Bahamians | 0.0 /100 | #300 | Tragic 16.6% |
| Guatemalans | 0.0 /100 | #301 | Tragic 16.7% |
| Chippewa | 0.0 /100 | #302 | Tragic 16.7% |
| Choctaw | 0.0 /100 | #303 | Tragic 16.8% |
| Immigrants | Central America | 0.0 /100 | #304 | Tragic 16.8% |
| Immigrants | Grenada | 0.0 /100 | #305 | Tragic 16.8% |
| Immigrants | Caribbean | 0.0 /100 | #306 | Tragic 16.9% |
| Seminole | 0.0 /100 | #307 | Tragic 16.9% |