Immigrants from Ecuador vs Thai Female Poverty
COMPARE
Immigrants from Ecuador
Thai
Female Poverty
Female Poverty Comparison
Immigrants from Ecuador
Thais
15.6%
FEMALE POVERTY
0.1/ 100
METRIC RATING
264th/ 347
METRIC RANK
10.5%
FEMALE POVERTY
100.0/ 100
METRIC RATING
3rd/ 347
METRIC RANK
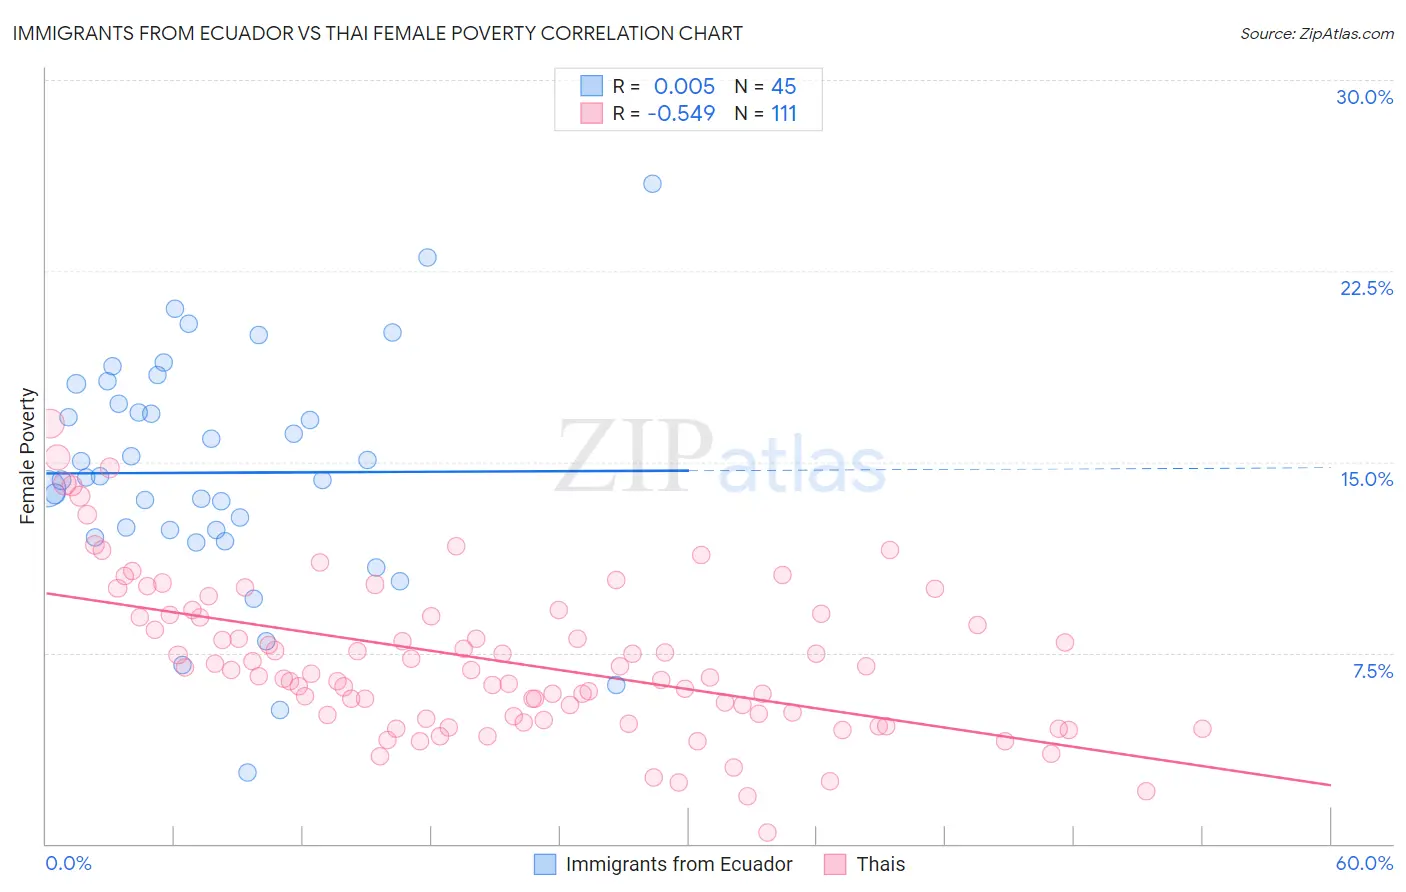
Immigrants from Ecuador vs Thai Female Poverty Correlation Chart
The statistical analysis conducted on geographies consisting of 270,847,702 people shows no correlation between the proportion of Immigrants from Ecuador and poverty level among females in the United States with a correlation coefficient (R) of 0.005 and weighted average of 15.6%. Similarly, the statistical analysis conducted on geographies consisting of 475,222,247 people shows a substantial negative correlation between the proportion of Thais and poverty level among females in the United States with a correlation coefficient (R) of -0.549 and weighted average of 10.5%, a difference of 49.5%.
Female Poverty Correlation Summary
| Measurement | Immigrants from Ecuador | Thai |
| Minimum | 2.8% | 0.46% |
| Maximum | 25.9% | 16.5% |
| Range | 23.1% | 16.0% |
| Mean | 14.6% | 7.2% |
| Median | 14.4% | 6.8% |
| Interquartile 25% (IQ1) | 12.2% | 5.0% |
| Interquartile 75% (IQ3) | 17.7% | 9.0% |
| Interquartile Range (IQR) | 5.5% | 4.0% |
| Standard Deviation (Sample) | 4.6% | 3.1% |
| Standard Deviation (Population) | 4.6% | 3.0% |
Similar Demographics by Female Poverty
Demographics Similar to Immigrants from Ecuador by Female Poverty
In terms of female poverty, the demographic groups most similar to Immigrants from Ecuador are Cherokee (15.6%, a difference of 0.13%), Guyanese (15.6%, a difference of 0.14%), Mexican American Indian (15.6%, a difference of 0.14%), Immigrants from Guyana (15.6%, a difference of 0.24%), and Immigrants from Liberia (15.7%, a difference of 0.30%).
| Demographics | Rating | Rank | Female Poverty |
| Immigrants | Jamaica | 0.1 /100 | #257 | Tragic 15.6% |
| Shoshone | 0.1 /100 | #258 | Tragic 15.6% |
| Cape Verdeans | 0.1 /100 | #259 | Tragic 15.6% |
| Immigrants | Guyana | 0.1 /100 | #260 | Tragic 15.6% |
| Guyanese | 0.1 /100 | #261 | Tragic 15.6% |
| Mexican American Indians | 0.1 /100 | #262 | Tragic 15.6% |
| Cherokee | 0.1 /100 | #263 | Tragic 15.6% |
| Immigrants | Ecuador | 0.1 /100 | #264 | Tragic 15.6% |
| Immigrants | Liberia | 0.1 /100 | #265 | Tragic 15.7% |
| Immigrants | El Salvador | 0.1 /100 | #266 | Tragic 15.7% |
| Sub-Saharan Africans | 0.1 /100 | #267 | Tragic 15.8% |
| Immigrants | Nicaragua | 0.1 /100 | #268 | Tragic 15.8% |
| Iroquois | 0.1 /100 | #269 | Tragic 15.8% |
| Chickasaw | 0.1 /100 | #270 | Tragic 15.9% |
| Immigrants | St. Vincent and the Grenadines | 0.0 /100 | #271 | Tragic 15.9% |
Demographics Similar to Thais by Female Poverty
In terms of female poverty, the demographic groups most similar to Thais are Chinese (10.4%, a difference of 0.65%), Immigrants from Taiwan (10.5%, a difference of 0.76%), Filipino (10.9%, a difference of 4.7%), Immigrants from Ireland (11.0%, a difference of 5.1%), and Assyrian/Chaldean/Syriac (11.0%, a difference of 5.5%).
| Demographics | Rating | Rank | Female Poverty |
| Immigrants | India | 100.0 /100 | #1 | Exceptional 9.9% |
| Chinese | 100.0 /100 | #2 | Exceptional 10.4% |
| Thais | 100.0 /100 | #3 | Exceptional 10.5% |
| Immigrants | Taiwan | 100.0 /100 | #4 | Exceptional 10.5% |
| Filipinos | 100.0 /100 | #5 | Exceptional 10.9% |
| Immigrants | Ireland | 99.9 /100 | #6 | Exceptional 11.0% |
| Assyrians/Chaldeans/Syriacs | 99.9 /100 | #7 | Exceptional 11.0% |
| Immigrants | South Central Asia | 99.9 /100 | #8 | Exceptional 11.1% |
| Bulgarians | 99.9 /100 | #9 | Exceptional 11.1% |
| Immigrants | Hong Kong | 99.9 /100 | #10 | Exceptional 11.2% |
| Maltese | 99.9 /100 | #11 | Exceptional 11.2% |
| Bhutanese | 99.9 /100 | #12 | Exceptional 11.3% |
| Immigrants | Lithuania | 99.9 /100 | #13 | Exceptional 11.3% |
| Lithuanians | 99.8 /100 | #14 | Exceptional 11.4% |
| Latvians | 99.8 /100 | #15 | Exceptional 11.4% |