Immigrants from Sweden vs Bahamian Female Poverty
COMPARE
Immigrants from Sweden
Bahamian
Female Poverty
Female Poverty Comparison
Immigrants from Sweden
Bahamians
12.3%
FEMALE POVERTY
97.1/ 100
METRIC RATING
81st/ 347
METRIC RANK
16.6%
FEMALE POVERTY
0.0/ 100
METRIC RATING
300th/ 347
METRIC RANK
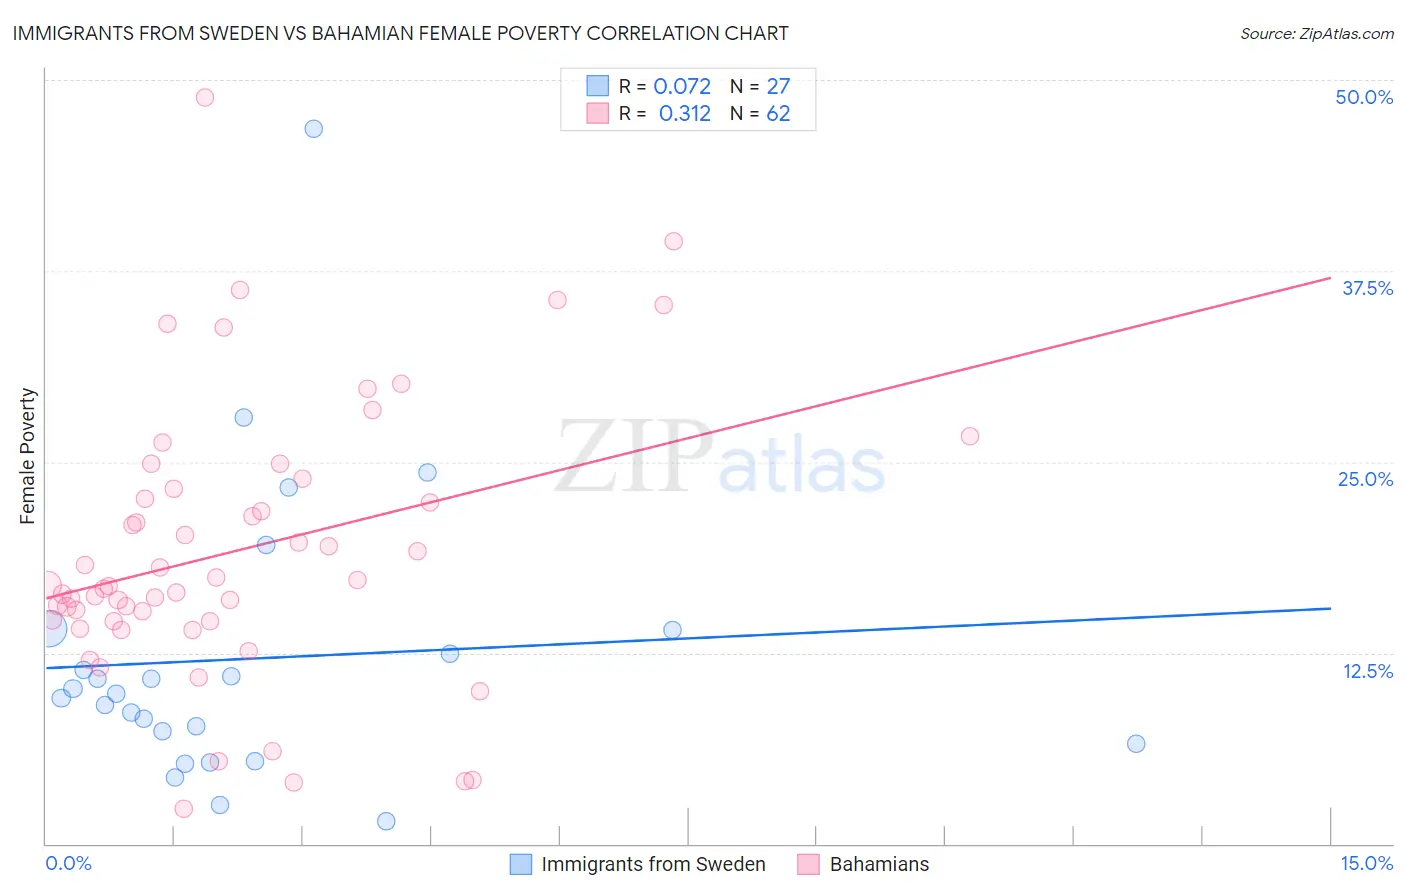
Immigrants from Sweden vs Bahamian Female Poverty Correlation Chart
The statistical analysis conducted on geographies consisting of 164,683,428 people shows a slight positive correlation between the proportion of Immigrants from Sweden and poverty level among females in the United States with a correlation coefficient (R) of 0.072 and weighted average of 12.3%. Similarly, the statistical analysis conducted on geographies consisting of 112,629,599 people shows a mild positive correlation between the proportion of Bahamians and poverty level among females in the United States with a correlation coefficient (R) of 0.312 and weighted average of 16.6%, a difference of 35.2%.
Female Poverty Correlation Summary
| Measurement | Immigrants from Sweden | Bahamian |
| Minimum | 1.5% | 2.3% |
| Maximum | 46.8% | 48.8% |
| Range | 45.4% | 46.5% |
| Mean | 12.1% | 19.2% |
| Median | 9.8% | 16.9% |
| Interquartile 25% (IQ1) | 6.5% | 14.6% |
| Interquartile 75% (IQ3) | 14.0% | 23.2% |
| Interquartile Range (IQR) | 7.5% | 8.7% |
| Standard Deviation (Sample) | 9.5% | 9.1% |
| Standard Deviation (Population) | 9.3% | 9.0% |
Similar Demographics by Female Poverty
Demographics Similar to Immigrants from Sweden by Female Poverty
In terms of female poverty, the demographic groups most similar to Immigrants from Sweden are Slovak (12.3%, a difference of 0.0%), Jordanian (12.3%, a difference of 0.010%), Immigrants from North America (12.3%, a difference of 0.050%), Egyptian (12.3%, a difference of 0.12%), and Serbian (12.3%, a difference of 0.13%).
| Demographics | Rating | Rank | Female Poverty |
| Immigrants | Canada | 97.5 /100 | #74 | Exceptional 12.3% |
| Europeans | 97.4 /100 | #75 | Exceptional 12.3% |
| Immigrants | Eastern Europe | 97.2 /100 | #76 | Exceptional 12.3% |
| Serbians | 97.2 /100 | #77 | Exceptional 12.3% |
| Egyptians | 97.2 /100 | #78 | Exceptional 12.3% |
| Immigrants | North America | 97.1 /100 | #79 | Exceptional 12.3% |
| Slovaks | 97.1 /100 | #80 | Exceptional 12.3% |
| Immigrants | Sweden | 97.1 /100 | #81 | Exceptional 12.3% |
| Jordanians | 97.1 /100 | #82 | Exceptional 12.3% |
| Immigrants | England | 96.9 /100 | #83 | Exceptional 12.3% |
| Northern Europeans | 96.6 /100 | #84 | Exceptional 12.4% |
| Irish | 96.5 /100 | #85 | Exceptional 12.4% |
| Dutch | 96.5 /100 | #86 | Exceptional 12.4% |
| Okinawans | 96.4 /100 | #87 | Exceptional 12.4% |
| Finns | 96.4 /100 | #88 | Exceptional 12.4% |
Demographics Similar to Bahamians by Female Poverty
In terms of female poverty, the demographic groups most similar to Bahamians are Hispanic or Latino (16.6%, a difference of 0.040%), Guatemalan (16.7%, a difference of 0.33%), Chippewa (16.7%, a difference of 0.36%), Somali (16.6%, a difference of 0.56%), and Mexican (16.5%, a difference of 0.77%).
| Demographics | Rating | Rank | Female Poverty |
| Immigrants | Latin America | 0.0 /100 | #293 | Tragic 16.4% |
| Immigrants | Cabo Verde | 0.0 /100 | #294 | Tragic 16.4% |
| Senegalese | 0.0 /100 | #295 | Tragic 16.5% |
| Immigrants | Senegal | 0.0 /100 | #296 | Tragic 16.5% |
| Mexicans | 0.0 /100 | #297 | Tragic 16.5% |
| Somalis | 0.0 /100 | #298 | Tragic 16.6% |
| Hispanics or Latinos | 0.0 /100 | #299 | Tragic 16.6% |
| Bahamians | 0.0 /100 | #300 | Tragic 16.6% |
| Guatemalans | 0.0 /100 | #301 | Tragic 16.7% |
| Chippewa | 0.0 /100 | #302 | Tragic 16.7% |
| Choctaw | 0.0 /100 | #303 | Tragic 16.8% |
| Immigrants | Central America | 0.0 /100 | #304 | Tragic 16.8% |
| Immigrants | Grenada | 0.0 /100 | #305 | Tragic 16.8% |
| Immigrants | Caribbean | 0.0 /100 | #306 | Tragic 16.9% |
| Seminole | 0.0 /100 | #307 | Tragic 16.9% |