Yugoslavian vs Guamanian/Chamorro Poverty
COMPARE
Yugoslavian
Guamanian/Chamorro
Poverty
Poverty Comparison
Yugoslavians
Guamanians/Chamorros
11.8%
POVERTY
85.2/ 100
METRIC RATING
134th/ 347
METRIC RANK
12.1%
POVERTY
63.9/ 100
METRIC RATING
154th/ 347
METRIC RANK
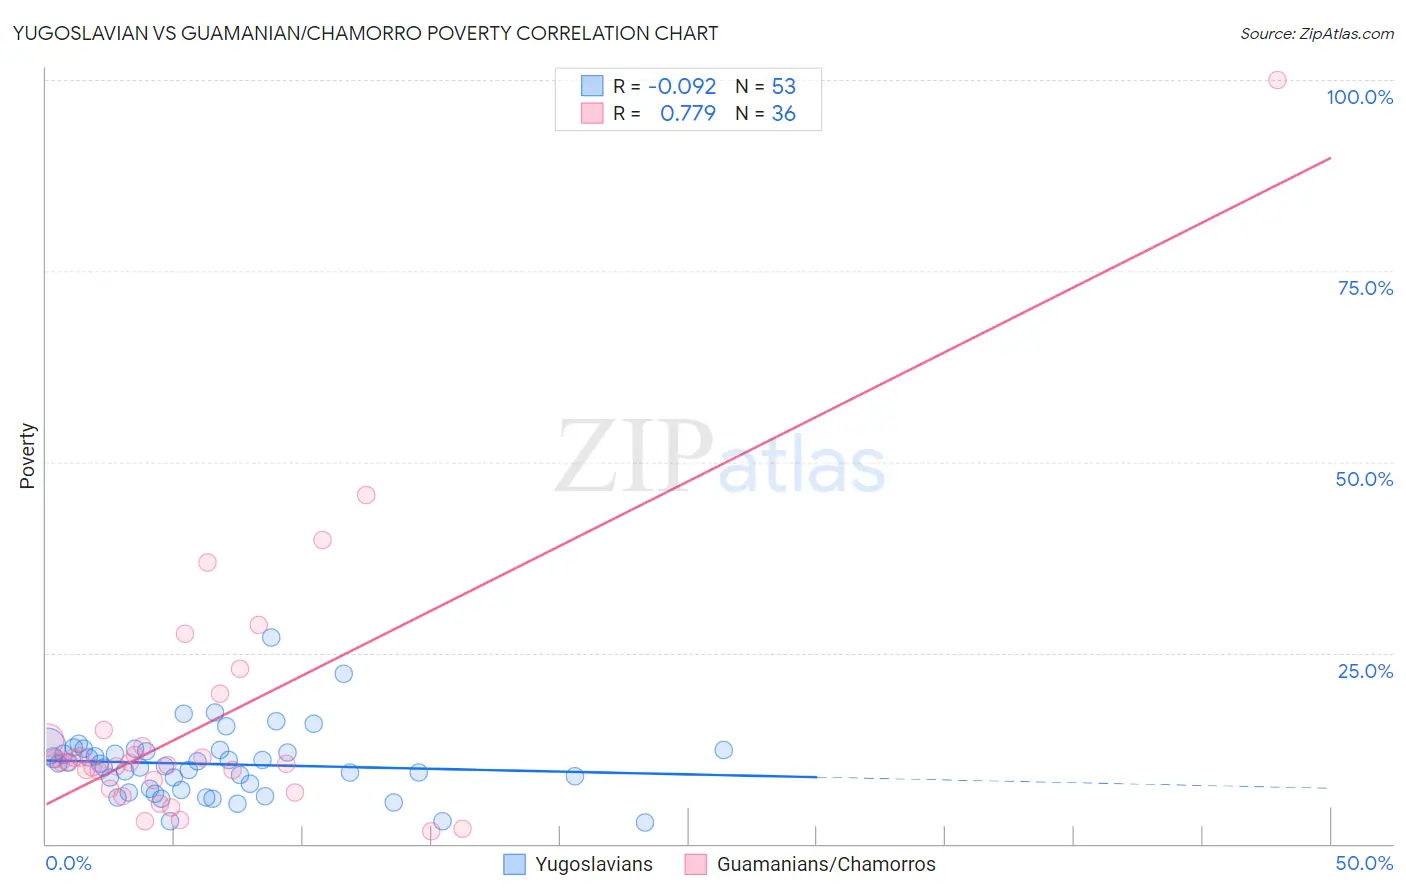
Yugoslavian vs Guamanian/Chamorro Poverty Correlation Chart
The statistical analysis conducted on geographies consisting of 285,571,582 people shows a slight negative correlation between the proportion of Yugoslavians and poverty level in the United States with a correlation coefficient (R) of -0.092 and weighted average of 11.8%. Similarly, the statistical analysis conducted on geographies consisting of 221,867,885 people shows a strong positive correlation between the proportion of Guamanians/Chamorros and poverty level in the United States with a correlation coefficient (R) of 0.779 and weighted average of 12.1%, a difference of 3.0%.
Poverty Correlation Summary
| Measurement | Yugoslavian | Guamanian/Chamorro |
| Minimum | 2.7% | 1.7% |
| Maximum | 27.0% | 100.0% |
| Range | 24.3% | 98.3% |
| Mean | 10.4% | 15.8% |
| Median | 10.5% | 10.7% |
| Interquartile 25% (IQ1) | 7.1% | 7.8% |
| Interquartile 75% (IQ3) | 12.3% | 14.3% |
| Interquartile Range (IQR) | 5.2% | 6.5% |
| Standard Deviation (Sample) | 4.4% | 17.8% |
| Standard Deviation (Population) | 4.4% | 17.5% |
Demographics Similar to Yugoslavians and Guamanians/Chamorros by Poverty
In terms of poverty, the demographic groups most similar to Yugoslavians are Immigrants from Vietnam (11.8%, a difference of 0.010%), Chilean (11.8%, a difference of 0.20%), Immigrants from Switzerland (11.8%, a difference of 0.42%), Immigrants from Jordan (11.9%, a difference of 0.53%), and Pakistani (11.9%, a difference of 0.56%). Similarly, the demographic groups most similar to Guamanians/Chamorros are Immigrants from Northern Africa (12.1%, a difference of 0.010%), Armenian (12.1%, a difference of 0.41%), Samoan (12.0%, a difference of 0.92%), Immigrants from Kazakhstan (12.0%, a difference of 0.96%), and Immigrants from Malaysia (12.0%, a difference of 1.0%).
| Demographics | Rating | Rank | Poverty |
| Yugoslavians | 85.2 /100 | #134 | Excellent 11.8% |
| Immigrants | Vietnam | 85.2 /100 | #135 | Excellent 11.8% |
| Chileans | 84.2 /100 | #136 | Excellent 11.8% |
| Immigrants | Switzerland | 83.0 /100 | #137 | Excellent 11.8% |
| Immigrants | Jordan | 82.4 /100 | #138 | Excellent 11.9% |
| Pakistanis | 82.2 /100 | #139 | Excellent 11.9% |
| Immigrants | Peru | 81.1 /100 | #140 | Excellent 11.9% |
| Immigrants | France | 80.5 /100 | #141 | Excellent 11.9% |
| Basques | 80.4 /100 | #142 | Excellent 11.9% |
| Brazilians | 79.7 /100 | #143 | Good 11.9% |
| Icelanders | 77.9 /100 | #144 | Good 11.9% |
| Syrians | 75.1 /100 | #145 | Good 12.0% |
| Afghans | 74.9 /100 | #146 | Good 12.0% |
| Immigrants | Bosnia and Herzegovina | 73.7 /100 | #147 | Good 12.0% |
| Immigrants | Germany | 72.7 /100 | #148 | Good 12.0% |
| Immigrants | Malaysia | 72.7 /100 | #149 | Good 12.0% |
| Immigrants | Kazakhstan | 72.3 /100 | #150 | Good 12.0% |
| Samoans | 71.9 /100 | #151 | Good 12.0% |
| Armenians | 67.6 /100 | #152 | Good 12.1% |
| Immigrants | Northern Africa | 63.9 /100 | #153 | Good 12.1% |
| Guamanians/Chamorros | 63.9 /100 | #154 | Good 12.1% |