Aleut vs Guamanian/Chamorro Poverty
COMPARE
Aleut
Guamanian/Chamorro
Poverty
Poverty Comparison
Aleuts
Guamanians/Chamorros
12.5%
POVERTY
33.2/ 100
METRIC RATING
189th/ 347
METRIC RANK
12.1%
POVERTY
63.9/ 100
METRIC RATING
154th/ 347
METRIC RANK
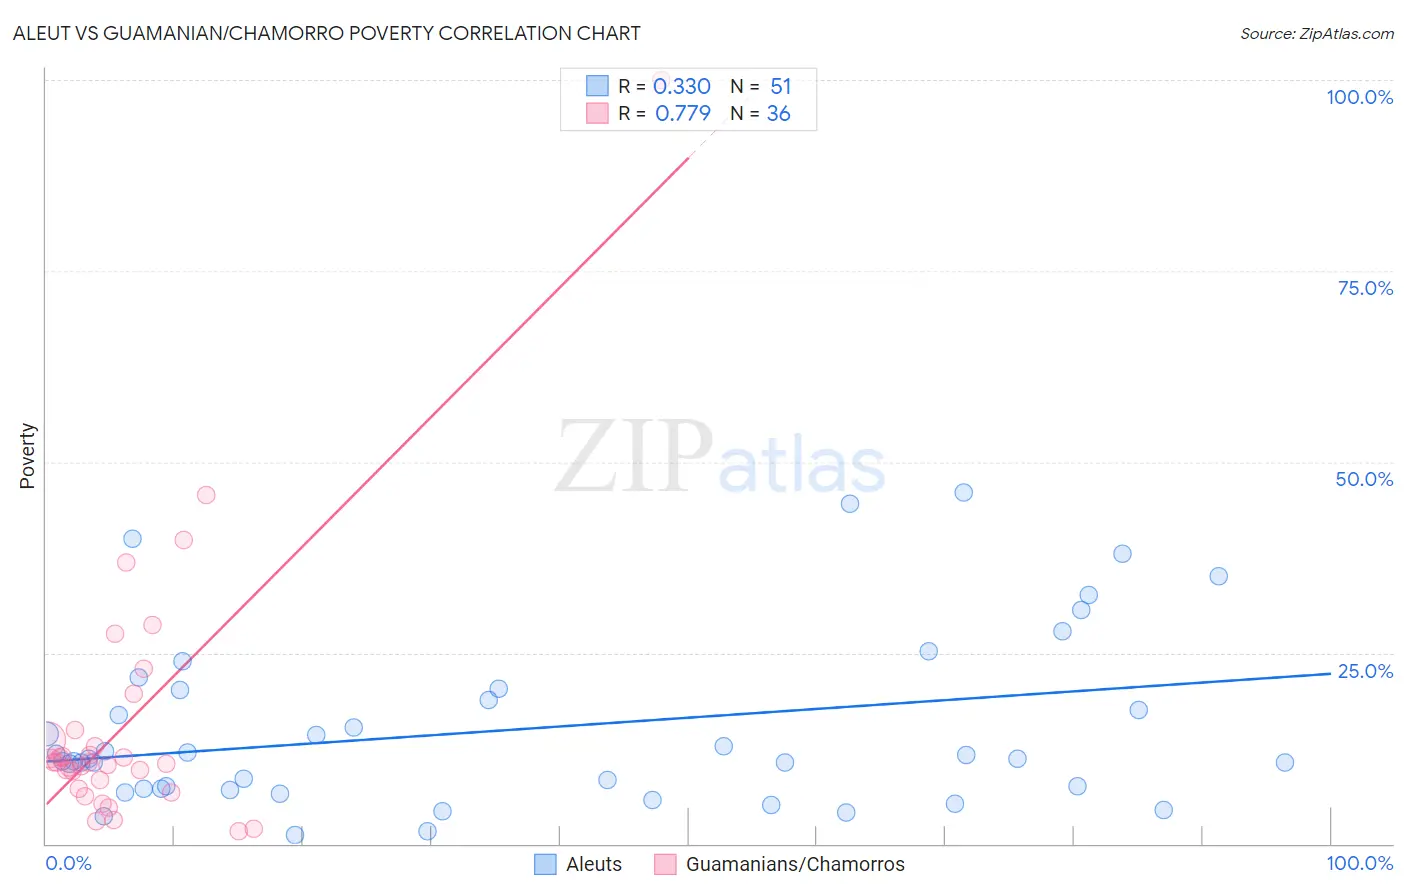
Aleut vs Guamanian/Chamorro Poverty Correlation Chart
The statistical analysis conducted on geographies consisting of 61,776,173 people shows a mild positive correlation between the proportion of Aleuts and poverty level in the United States with a correlation coefficient (R) of 0.330 and weighted average of 12.5%. Similarly, the statistical analysis conducted on geographies consisting of 221,867,885 people shows a strong positive correlation between the proportion of Guamanians/Chamorros and poverty level in the United States with a correlation coefficient (R) of 0.779 and weighted average of 12.1%, a difference of 3.1%.
Poverty Correlation Summary
| Measurement | Aleut | Guamanian/Chamorro |
| Minimum | 1.1% | 1.7% |
| Maximum | 46.0% | 100.0% |
| Range | 44.9% | 98.3% |
| Mean | 14.9% | 15.8% |
| Median | 11.1% | 10.7% |
| Interquartile 25% (IQ1) | 7.2% | 7.8% |
| Interquartile 75% (IQ3) | 20.2% | 14.3% |
| Interquartile Range (IQR) | 13.0% | 6.5% |
| Standard Deviation (Sample) | 11.2% | 17.8% |
| Standard Deviation (Population) | 11.1% | 17.5% |
Similar Demographics by Poverty
Demographics Similar to Aleuts by Poverty
In terms of poverty, the demographic groups most similar to Aleuts are Immigrants from Costa Rica (12.5%, a difference of 0.010%), Hawaiian (12.5%, a difference of 0.090%), Immigrants from South America (12.5%, a difference of 0.090%), Sierra Leonean (12.6%, a difference of 0.19%), and Immigrants from Sierra Leone (12.5%, a difference of 0.32%).
| Demographics | Rating | Rank | Poverty |
| Immigrants | Cameroon | 41.7 /100 | #182 | Average 12.4% |
| Immigrants | Iraq | 40.2 /100 | #183 | Average 12.4% |
| Kenyans | 38.8 /100 | #184 | Fair 12.5% |
| Israelis | 36.4 /100 | #185 | Fair 12.5% |
| Immigrants | Sierra Leone | 36.3 /100 | #186 | Fair 12.5% |
| Hawaiians | 34.1 /100 | #187 | Fair 12.5% |
| Immigrants | Costa Rica | 33.3 /100 | #188 | Fair 12.5% |
| Aleuts | 33.2 /100 | #189 | Fair 12.5% |
| Immigrants | South America | 32.3 /100 | #190 | Fair 12.5% |
| Sierra Leoneans | 31.5 /100 | #191 | Fair 12.6% |
| South American Indians | 23.3 /100 | #192 | Fair 12.7% |
| Delaware | 21.4 /100 | #193 | Fair 12.7% |
| Arabs | 21.1 /100 | #194 | Fair 12.7% |
| Immigrants | Kuwait | 20.9 /100 | #195 | Fair 12.7% |
| Iraqis | 20.8 /100 | #196 | Fair 12.7% |
Demographics Similar to Guamanians/Chamorros by Poverty
In terms of poverty, the demographic groups most similar to Guamanians/Chamorros are Immigrants from Northern Africa (12.1%, a difference of 0.010%), Hungarian (12.2%, a difference of 0.020%), Scotch-Irish (12.2%, a difference of 0.14%), Costa Rican (12.2%, a difference of 0.18%), and Taiwanese (12.2%, a difference of 0.22%).
| Demographics | Rating | Rank | Poverty |
| Immigrants | Bosnia and Herzegovina | 73.7 /100 | #147 | Good 12.0% |
| Immigrants | Germany | 72.7 /100 | #148 | Good 12.0% |
| Immigrants | Malaysia | 72.7 /100 | #149 | Good 12.0% |
| Immigrants | Kazakhstan | 72.3 /100 | #150 | Good 12.0% |
| Samoans | 71.9 /100 | #151 | Good 12.0% |
| Armenians | 67.6 /100 | #152 | Good 12.1% |
| Immigrants | Northern Africa | 63.9 /100 | #153 | Good 12.1% |
| Guamanians/Chamorros | 63.9 /100 | #154 | Good 12.1% |
| Hungarians | 63.6 /100 | #155 | Good 12.2% |
| Scotch-Irish | 62.6 /100 | #156 | Good 12.2% |
| Costa Ricans | 62.2 /100 | #157 | Good 12.2% |
| Taiwanese | 61.8 /100 | #158 | Good 12.2% |
| Pennsylvania Germans | 60.8 /100 | #159 | Good 12.2% |
| Immigrants | Nepal | 60.4 /100 | #160 | Good 12.2% |
| Immigrants | Fiji | 59.1 /100 | #161 | Average 12.2% |