Immigrants from Ghana vs Fijian Poverty
COMPARE
Immigrants from Ghana
Fijian
Poverty
Poverty Comparison
Immigrants from Ghana
Fijians
14.2%
POVERTY
0.2/ 100
METRIC RATING
249th/ 347
METRIC RANK
13.7%
POVERTY
0.8/ 100
METRIC RATING
232nd/ 347
METRIC RANK
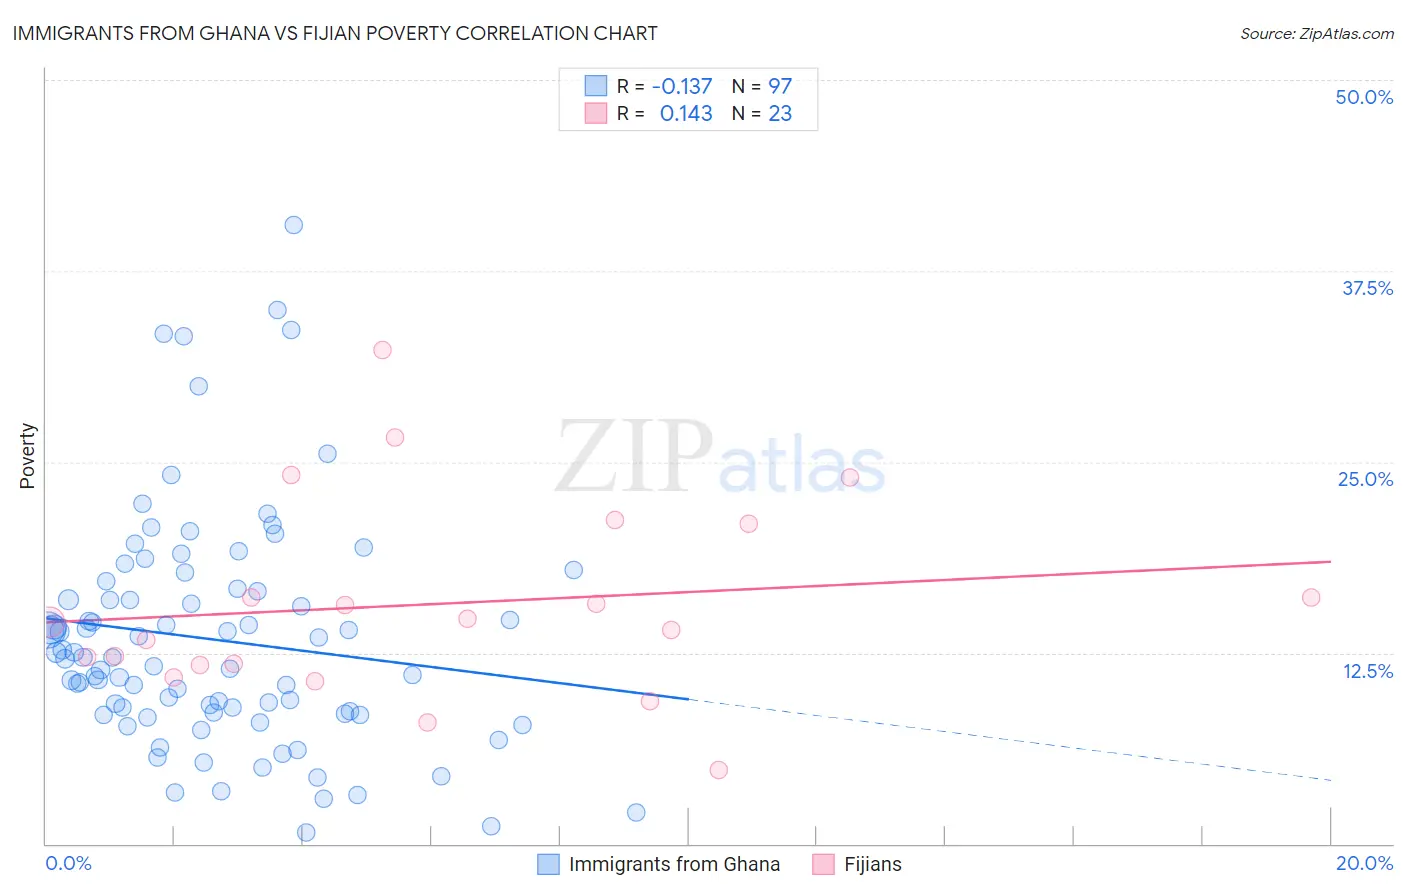
Immigrants from Ghana vs Fijian Poverty Correlation Chart
The statistical analysis conducted on geographies consisting of 199,808,032 people shows a poor negative correlation between the proportion of Immigrants from Ghana and poverty level in the United States with a correlation coefficient (R) of -0.137 and weighted average of 14.2%. Similarly, the statistical analysis conducted on geographies consisting of 55,947,896 people shows a poor positive correlation between the proportion of Fijians and poverty level in the United States with a correlation coefficient (R) of 0.143 and weighted average of 13.7%, a difference of 3.0%.
Poverty Correlation Summary
| Measurement | Immigrants from Ghana | Fijian |
| Minimum | 0.71% | 4.9% |
| Maximum | 40.5% | 32.3% |
| Range | 39.8% | 27.5% |
| Mean | 13.4% | 15.7% |
| Median | 12.2% | 14.5% |
| Interquartile 25% (IQ1) | 8.5% | 11.7% |
| Interquartile 75% (IQ3) | 16.6% | 21.0% |
| Interquartile Range (IQR) | 8.1% | 9.3% |
| Standard Deviation (Sample) | 7.6% | 6.5% |
| Standard Deviation (Population) | 7.5% | 6.3% |
Demographics Similar to Immigrants from Ghana and Fijians by Poverty
In terms of poverty, the demographic groups most similar to Immigrants from Ghana are Immigrants from Western Africa (14.1%, a difference of 0.090%), Liberian (14.1%, a difference of 0.11%), Cree (14.2%, a difference of 0.30%), Potawatomi (14.1%, a difference of 0.40%), and Immigrants from Sudan (14.1%, a difference of 0.59%). Similarly, the demographic groups most similar to Fijians are Immigrants from Saudi Arabia (13.8%, a difference of 0.25%), Immigrants from Laos (13.8%, a difference of 0.49%), Cuban (13.9%, a difference of 0.93%), Immigrants from Armenia (13.9%, a difference of 0.96%), and French American Indian (13.9%, a difference of 0.98%).
| Demographics | Rating | Rank | Poverty |
| Alaskan Athabascans | 1.5 /100 | #230 | Tragic 13.6% |
| Nigerians | 1.4 /100 | #231 | Tragic 13.6% |
| Fijians | 0.8 /100 | #232 | Tragic 13.7% |
| Immigrants | Saudi Arabia | 0.8 /100 | #233 | Tragic 13.8% |
| Immigrants | Laos | 0.7 /100 | #234 | Tragic 13.8% |
| Cubans | 0.6 /100 | #235 | Tragic 13.9% |
| Immigrants | Armenia | 0.5 /100 | #236 | Tragic 13.9% |
| French American Indians | 0.5 /100 | #237 | Tragic 13.9% |
| Ghanaians | 0.5 /100 | #238 | Tragic 13.9% |
| Nicaraguans | 0.4 /100 | #239 | Tragic 13.9% |
| Immigrants | Middle Africa | 0.4 /100 | #240 | Tragic 14.0% |
| Salvadorans | 0.4 /100 | #241 | Tragic 14.0% |
| Ecuadorians | 0.4 /100 | #242 | Tragic 14.0% |
| Sudanese | 0.3 /100 | #243 | Tragic 14.0% |
| Nepalese | 0.3 /100 | #244 | Tragic 14.0% |
| Immigrants | Sudan | 0.3 /100 | #245 | Tragic 14.1% |
| Potawatomi | 0.3 /100 | #246 | Tragic 14.1% |
| Liberians | 0.2 /100 | #247 | Tragic 14.1% |
| Immigrants | Western Africa | 0.2 /100 | #248 | Tragic 14.1% |
| Immigrants | Ghana | 0.2 /100 | #249 | Tragic 14.2% |
| Cree | 0.2 /100 | #250 | Tragic 14.2% |