Immigrants from Austria vs Fijian Poverty
COMPARE
Immigrants from Austria
Fijian
Poverty
Poverty Comparison
Immigrants from Austria
Fijians
11.1%
POVERTY
98.6/ 100
METRIC RATING
53rd/ 347
METRIC RANK
13.7%
POVERTY
0.8/ 100
METRIC RATING
232nd/ 347
METRIC RANK
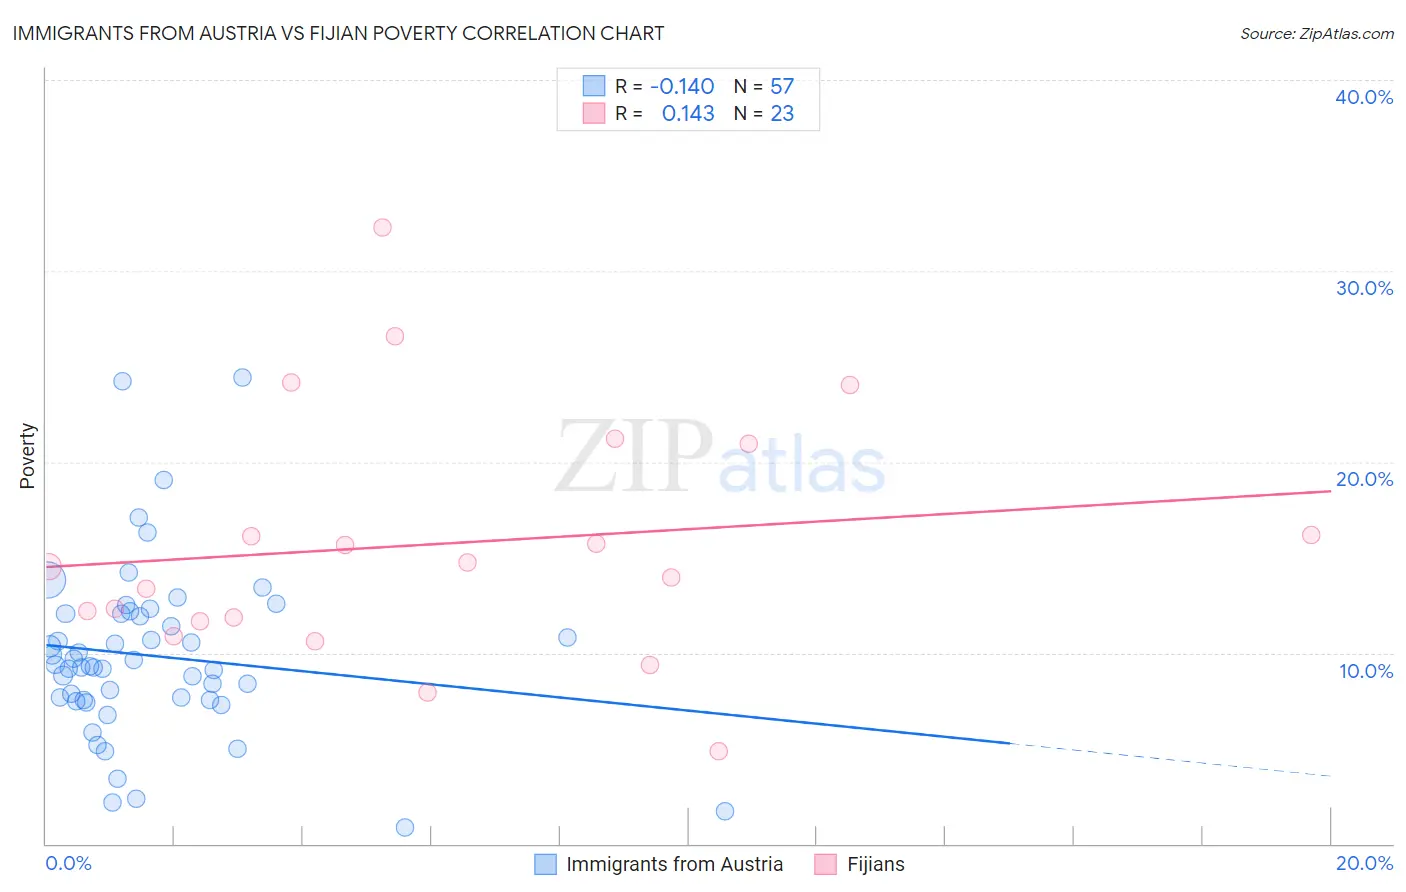
Immigrants from Austria vs Fijian Poverty Correlation Chart
The statistical analysis conducted on geographies consisting of 167,938,578 people shows a poor negative correlation between the proportion of Immigrants from Austria and poverty level in the United States with a correlation coefficient (R) of -0.140 and weighted average of 11.1%. Similarly, the statistical analysis conducted on geographies consisting of 55,947,896 people shows a poor positive correlation between the proportion of Fijians and poverty level in the United States with a correlation coefficient (R) of 0.143 and weighted average of 13.7%, a difference of 24.3%.
Poverty Correlation Summary
| Measurement | Immigrants from Austria | Fijian |
| Minimum | 0.88% | 4.9% |
| Maximum | 24.4% | 32.3% |
| Range | 23.6% | 27.5% |
| Mean | 9.8% | 15.7% |
| Median | 9.3% | 14.5% |
| Interquartile 25% (IQ1) | 7.5% | 11.7% |
| Interquartile 75% (IQ3) | 12.1% | 21.0% |
| Interquartile Range (IQR) | 4.5% | 9.3% |
| Standard Deviation (Sample) | 4.5% | 6.5% |
| Standard Deviation (Population) | 4.5% | 6.3% |
Similar Demographics by Poverty
Demographics Similar to Immigrants from Austria by Poverty
In terms of poverty, the demographic groups most similar to Immigrants from Austria are Immigrants from Bulgaria (11.1%, a difference of 0.12%), Immigrants from Serbia (11.1%, a difference of 0.15%), Immigrants from Philippines (11.0%, a difference of 0.23%), Immigrants from Croatia (11.0%, a difference of 0.24%), and Estonian (11.1%, a difference of 0.63%).
| Demographics | Rating | Rank | Poverty |
| Immigrants | Czechoslovakia | 98.9 /100 | #46 | Exceptional 11.0% |
| Immigrants | Romania | 98.9 /100 | #47 | Exceptional 11.0% |
| Slovenes | 98.9 /100 | #48 | Exceptional 11.0% |
| Immigrants | Japan | 98.9 /100 | #49 | Exceptional 11.0% |
| Asians | 98.9 /100 | #50 | Exceptional 11.0% |
| Immigrants | Croatia | 98.7 /100 | #51 | Exceptional 11.0% |
| Immigrants | Philippines | 98.7 /100 | #52 | Exceptional 11.0% |
| Immigrants | Austria | 98.6 /100 | #53 | Exceptional 11.1% |
| Immigrants | Bulgaria | 98.5 /100 | #54 | Exceptional 11.1% |
| Immigrants | Serbia | 98.5 /100 | #55 | Exceptional 11.1% |
| Estonians | 98.2 /100 | #56 | Exceptional 11.1% |
| Scandinavians | 98.2 /100 | #57 | Exceptional 11.1% |
| Germans | 98.1 /100 | #58 | Exceptional 11.1% |
| Immigrants | Europe | 98.0 /100 | #59 | Exceptional 11.2% |
| Immigrants | Sri Lanka | 97.9 /100 | #60 | Exceptional 11.2% |
Demographics Similar to Fijians by Poverty
In terms of poverty, the demographic groups most similar to Fijians are Immigrants from Saudi Arabia (13.8%, a difference of 0.25%), Immigrants from Laos (13.8%, a difference of 0.49%), Cuban (13.9%, a difference of 0.93%), Immigrants from Armenia (13.9%, a difference of 0.96%), and French American Indian (13.9%, a difference of 0.98%).
| Demographics | Rating | Rank | Poverty |
| German Russians | 2.2 /100 | #225 | Tragic 13.4% |
| Marshallese | 2.2 /100 | #226 | Tragic 13.4% |
| Alaska Natives | 2.1 /100 | #227 | Tragic 13.5% |
| Immigrants | Nigeria | 1.7 /100 | #228 | Tragic 13.5% |
| Osage | 1.5 /100 | #229 | Tragic 13.6% |
| Alaskan Athabascans | 1.5 /100 | #230 | Tragic 13.6% |
| Nigerians | 1.4 /100 | #231 | Tragic 13.6% |
| Fijians | 0.8 /100 | #232 | Tragic 13.7% |
| Immigrants | Saudi Arabia | 0.8 /100 | #233 | Tragic 13.8% |
| Immigrants | Laos | 0.7 /100 | #234 | Tragic 13.8% |
| Cubans | 0.6 /100 | #235 | Tragic 13.9% |
| Immigrants | Armenia | 0.5 /100 | #236 | Tragic 13.9% |
| French American Indians | 0.5 /100 | #237 | Tragic 13.9% |
| Ghanaians | 0.5 /100 | #238 | Tragic 13.9% |
| Nicaraguans | 0.4 /100 | #239 | Tragic 13.9% |