Immigrants from Croatia vs Fijian Vision Disability
COMPARE
Immigrants from Croatia
Fijian
Vision Disability
Vision Disability Comparison
Immigrants from Croatia
Fijians
2.1%
VISION DISABILITY
96.0/ 100
METRIC RATING
94th/ 347
METRIC RANK
2.4%
VISION DISABILITY
0.1/ 100
METRIC RATING
261st/ 347
METRIC RANK
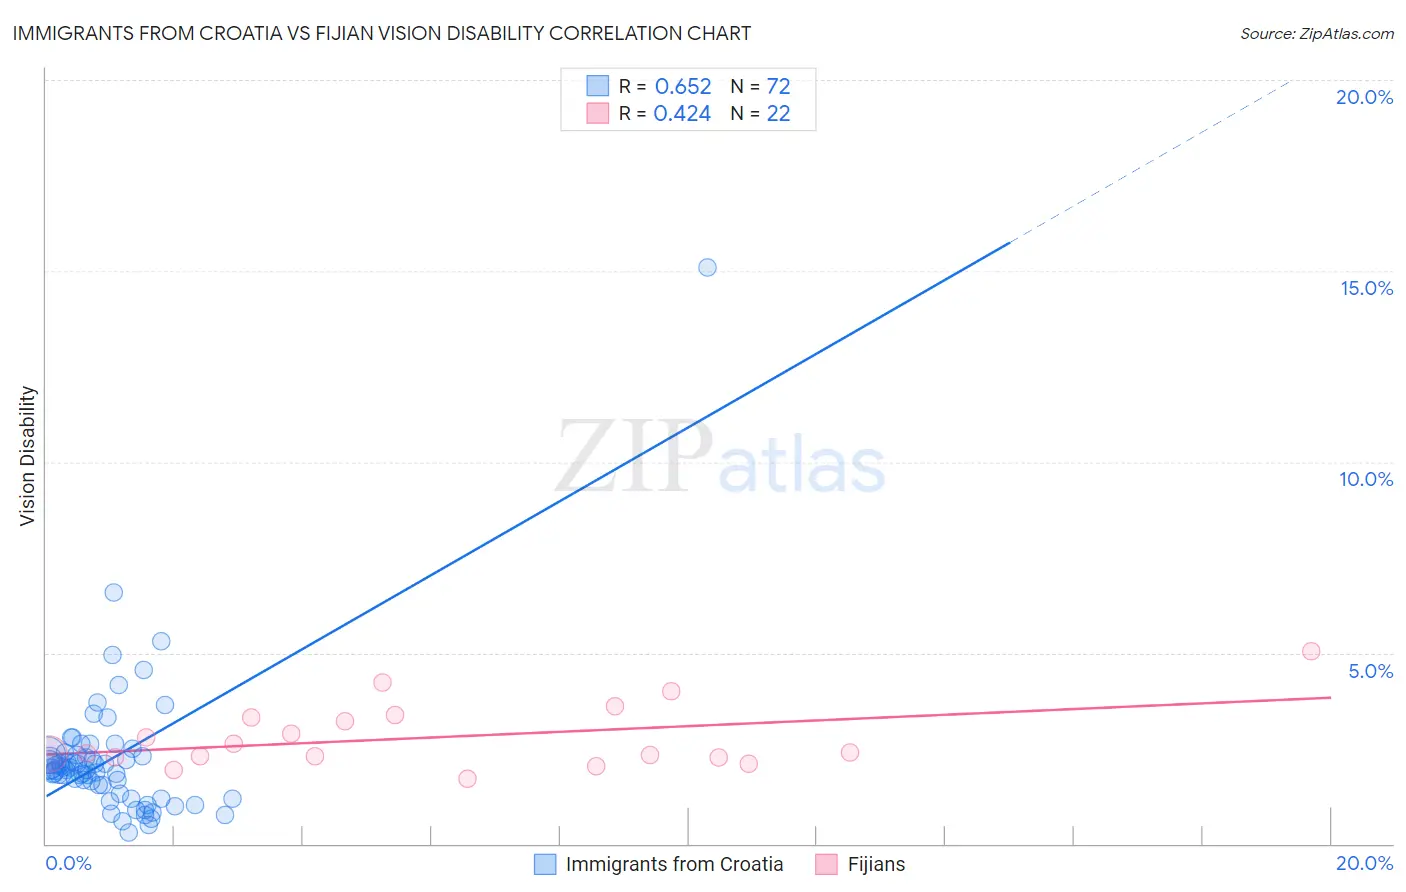
Immigrants from Croatia vs Fijian Vision Disability Correlation Chart
The statistical analysis conducted on geographies consisting of 132,552,000 people shows a significant positive correlation between the proportion of Immigrants from Croatia and percentage of population with vision disability in the United States with a correlation coefficient (R) of 0.652 and weighted average of 2.1%. Similarly, the statistical analysis conducted on geographies consisting of 55,940,410 people shows a moderate positive correlation between the proportion of Fijians and percentage of population with vision disability in the United States with a correlation coefficient (R) of 0.424 and weighted average of 2.4%, a difference of 16.1%.
Vision Disability Correlation Summary
| Measurement | Immigrants from Croatia | Fijian |
| Minimum | 0.31% | 1.7% |
| Maximum | 15.1% | 5.1% |
| Range | 14.8% | 3.3% |
| Mean | 2.2% | 2.8% |
| Median | 1.9% | 2.4% |
| Interquartile 25% (IQ1) | 1.4% | 2.3% |
| Interquartile 75% (IQ3) | 2.3% | 3.3% |
| Interquartile Range (IQR) | 0.91% | 1.0% |
| Standard Deviation (Sample) | 1.9% | 0.84% |
| Standard Deviation (Population) | 1.9% | 0.82% |
Similar Demographics by Vision Disability
Demographics Similar to Immigrants from Croatia by Vision Disability
In terms of vision disability, the demographic groups most similar to Immigrants from Croatia are Immigrants from Europe (2.1%, a difference of 0.020%), Immigrants from Syria (2.1%, a difference of 0.070%), Australian (2.1%, a difference of 0.070%), Immigrants from Somalia (2.1%, a difference of 0.090%), and Romanian (2.1%, a difference of 0.13%).
| Demographics | Rating | Rank | Vision Disability |
| Immigrants | Switzerland | 97.0 /100 | #87 | Exceptional 2.0% |
| Norwegians | 97.0 /100 | #88 | Exceptional 2.0% |
| Immigrants | Eastern Africa | 97.0 /100 | #89 | Exceptional 2.0% |
| Immigrants | Lebanon | 96.7 /100 | #90 | Exceptional 2.1% |
| Immigrants | Somalia | 96.2 /100 | #91 | Exceptional 2.1% |
| Immigrants | Syria | 96.2 /100 | #92 | Exceptional 2.1% |
| Immigrants | Europe | 96.1 /100 | #93 | Exceptional 2.1% |
| Immigrants | Croatia | 96.0 /100 | #94 | Exceptional 2.1% |
| Australians | 95.9 /100 | #95 | Exceptional 2.1% |
| Romanians | 95.7 /100 | #96 | Exceptional 2.1% |
| Immigrants | Afghanistan | 95.6 /100 | #97 | Exceptional 2.1% |
| Immigrants | South Africa | 95.4 /100 | #98 | Exceptional 2.1% |
| Estonians | 95.3 /100 | #99 | Exceptional 2.1% |
| Greeks | 95.1 /100 | #100 | Exceptional 2.1% |
| Albanians | 94.9 /100 | #101 | Exceptional 2.1% |
Demographics Similar to Fijians by Vision Disability
In terms of vision disability, the demographic groups most similar to Fijians are Jamaican (2.4%, a difference of 0.030%), Belizean (2.4%, a difference of 0.21%), Immigrants from Belize (2.4%, a difference of 0.28%), White/Caucasian (2.4%, a difference of 0.38%), and British West Indian (2.4%, a difference of 0.40%).
| Demographics | Rating | Rank | Vision Disability |
| Haitians | 0.3 /100 | #254 | Tragic 2.4% |
| Immigrants | Guatemala | 0.3 /100 | #255 | Tragic 2.4% |
| Immigrants | Haiti | 0.2 /100 | #256 | Tragic 2.4% |
| West Indians | 0.2 /100 | #257 | Tragic 2.4% |
| British West Indians | 0.2 /100 | #258 | Tragic 2.4% |
| Whites/Caucasians | 0.2 /100 | #259 | Tragic 2.4% |
| Belizeans | 0.2 /100 | #260 | Tragic 2.4% |
| Fijians | 0.1 /100 | #261 | Tragic 2.4% |
| Jamaicans | 0.1 /100 | #262 | Tragic 2.4% |
| Immigrants | Belize | 0.1 /100 | #263 | Tragic 2.4% |
| Immigrants | Liberia | 0.1 /100 | #264 | Tragic 2.4% |
| Immigrants | Jamaica | 0.1 /100 | #265 | Tragic 2.4% |
| Mexican American Indians | 0.1 /100 | #266 | Tragic 2.4% |
| Ute | 0.1 /100 | #267 | Tragic 2.4% |
| Senegalese | 0.1 /100 | #268 | Tragic 2.4% |