Immigrants from Congo vs Immigrants from El Salvador GED/Equivalency
COMPARE
Immigrants from Congo
Immigrants from El Salvador
GED/Equivalency
GED/Equivalency Comparison
Immigrants from Congo
Immigrants from El Salvador
83.1%
GED/EQUIVALENCY
0.2/ 100
METRIC RATING
263rd/ 347
METRIC RANK
77.6%
GED/EQUIVALENCY
0.0/ 100
METRIC RATING
339th/ 347
METRIC RANK
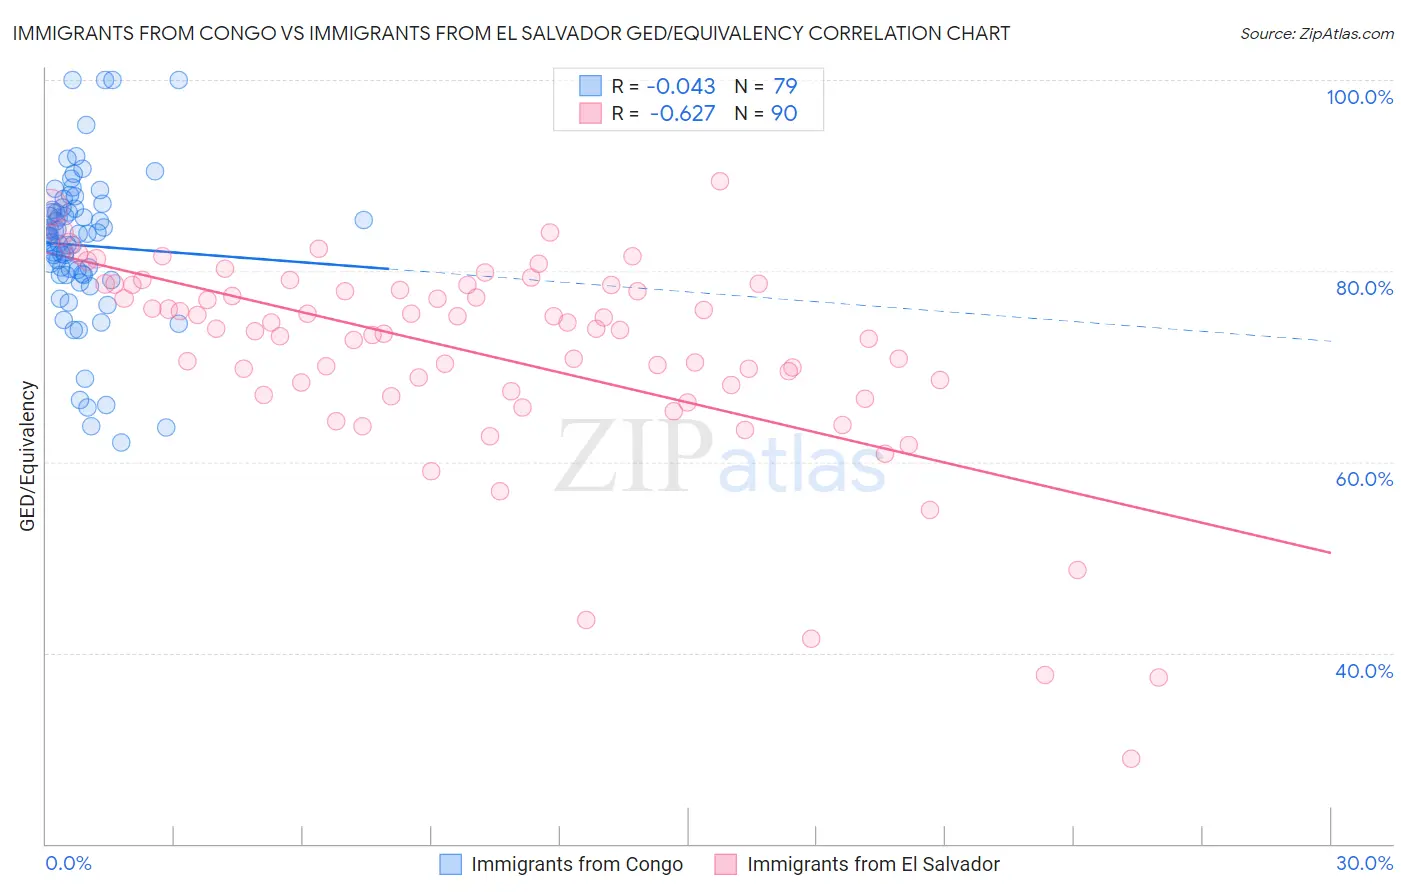
Immigrants from Congo vs Immigrants from El Salvador GED/Equivalency Correlation Chart
The statistical analysis conducted on geographies consisting of 92,095,910 people shows no correlation between the proportion of Immigrants from Congo and percentage of population with at least ged/equivalency education in the United States with a correlation coefficient (R) of -0.043 and weighted average of 83.1%. Similarly, the statistical analysis conducted on geographies consisting of 357,852,938 people shows a significant negative correlation between the proportion of Immigrants from El Salvador and percentage of population with at least ged/equivalency education in the United States with a correlation coefficient (R) of -0.627 and weighted average of 77.6%, a difference of 7.0%.
GED/Equivalency Correlation Summary
| Measurement | Immigrants from Congo | Immigrants from El Salvador |
| Minimum | 62.0% | 29.0% |
| Maximum | 100.0% | 89.4% |
| Range | 38.0% | 60.4% |
| Mean | 82.7% | 71.2% |
| Median | 83.7% | 73.8% |
| Interquartile 25% (IQ1) | 79.5% | 67.4% |
| Interquartile 75% (IQ3) | 86.5% | 78.5% |
| Interquartile Range (IQR) | 7.0% | 11.1% |
| Standard Deviation (Sample) | 7.9% | 10.9% |
| Standard Deviation (Population) | 7.8% | 10.8% |
Similar Demographics by GED/Equivalency
Demographics Similar to Immigrants from Congo by GED/Equivalency
In terms of ged/equivalency, the demographic groups most similar to Immigrants from Congo are Inupiat (83.1%, a difference of 0.010%), Immigrants from Armenia (83.1%, a difference of 0.010%), Bangladeshi (83.1%, a difference of 0.010%), West Indian (83.1%, a difference of 0.020%), and Kiowa (83.1%, a difference of 0.030%).
| Demographics | Rating | Rank | GED/Equivalency |
| Africans | 0.5 /100 | #256 | Tragic 83.4% |
| Jamaicans | 0.4 /100 | #257 | Tragic 83.3% |
| Malaysians | 0.4 /100 | #258 | Tragic 83.3% |
| Immigrants | Vietnam | 0.3 /100 | #259 | Tragic 83.2% |
| Choctaw | 0.3 /100 | #260 | Tragic 83.1% |
| Inupiat | 0.2 /100 | #261 | Tragic 83.1% |
| Immigrants | Armenia | 0.2 /100 | #262 | Tragic 83.1% |
| Immigrants | Congo | 0.2 /100 | #263 | Tragic 83.1% |
| Bangladeshis | 0.2 /100 | #264 | Tragic 83.1% |
| West Indians | 0.2 /100 | #265 | Tragic 83.1% |
| Kiowa | 0.2 /100 | #266 | Tragic 83.1% |
| Trinidadians and Tobagonians | 0.2 /100 | #267 | Tragic 83.0% |
| Immigrants | Burma/Myanmar | 0.2 /100 | #268 | Tragic 83.0% |
| Hopi | 0.2 /100 | #269 | Tragic 83.0% |
| Immigrants | Jamaica | 0.2 /100 | #270 | Tragic 82.9% |
Demographics Similar to Immigrants from El Salvador by GED/Equivalency
In terms of ged/equivalency, the demographic groups most similar to Immigrants from El Salvador are Tohono O'odham (77.5%, a difference of 0.16%), Mexican (77.4%, a difference of 0.24%), Immigrants from Guatemala (77.9%, a difference of 0.38%), Immigrants from Yemen (77.9%, a difference of 0.41%), and Immigrants from Dominican Republic (78.0%, a difference of 0.47%).
| Demographics | Rating | Rank | GED/Equivalency |
| Immigrants | Azores | 0.0 /100 | #332 | Tragic 78.7% |
| Salvadorans | 0.0 /100 | #333 | Tragic 78.6% |
| Guatemalans | 0.0 /100 | #334 | Tragic 78.5% |
| Immigrants | Latin America | 0.0 /100 | #335 | Tragic 78.5% |
| Immigrants | Dominican Republic | 0.0 /100 | #336 | Tragic 78.0% |
| Immigrants | Yemen | 0.0 /100 | #337 | Tragic 77.9% |
| Immigrants | Guatemala | 0.0 /100 | #338 | Tragic 77.9% |
| Immigrants | El Salvador | 0.0 /100 | #339 | Tragic 77.6% |
| Tohono O'odham | 0.0 /100 | #340 | Tragic 77.5% |
| Mexicans | 0.0 /100 | #341 | Tragic 77.4% |
| Pima | 0.0 /100 | #342 | Tragic 76.4% |
| Immigrants | Central America | 0.0 /100 | #343 | Tragic 76.4% |
| Spanish American Indians | 0.0 /100 | #344 | Tragic 76.3% |
| Immigrants | Mexico | 0.0 /100 | #345 | Tragic 75.7% |
| Houma | 0.0 /100 | #346 | Tragic 75.0% |