Immigrants from Ghana vs Immigrants from El Salvador Female Poverty
COMPARE
Immigrants from Ghana
Immigrants from El Salvador
Female Poverty
Female Poverty Comparison
Immigrants from Ghana
Immigrants from El Salvador
15.3%
FEMALE POVERTY
0.3/ 100
METRIC RATING
248th/ 347
METRIC RANK
15.7%
FEMALE POVERTY
0.1/ 100
METRIC RATING
266th/ 347
METRIC RANK
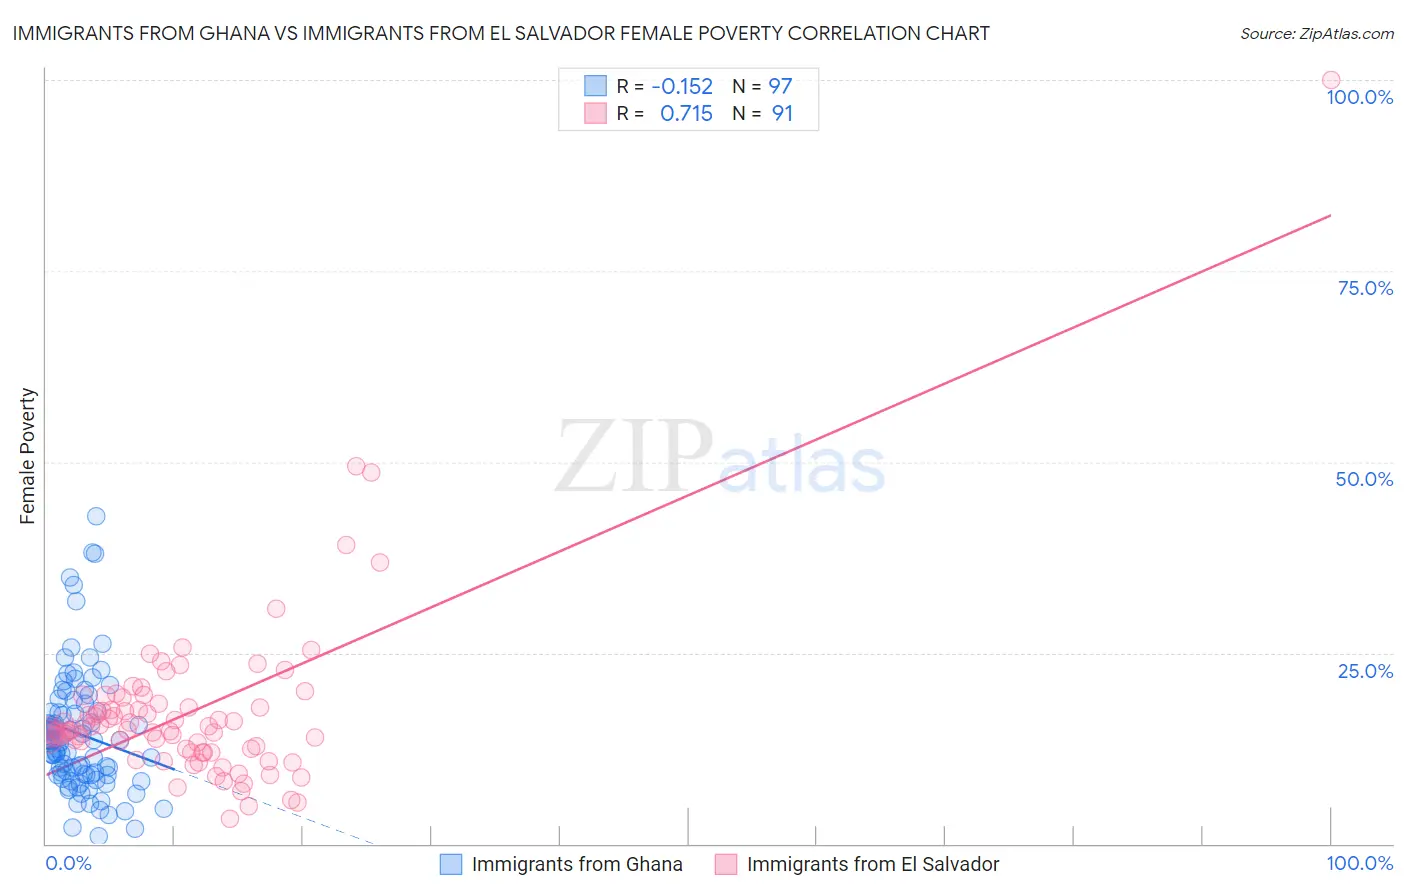
Immigrants from Ghana vs Immigrants from El Salvador Female Poverty Correlation Chart
The statistical analysis conducted on geographies consisting of 199,796,197 people shows a poor negative correlation between the proportion of Immigrants from Ghana and poverty level among females in the United States with a correlation coefficient (R) of -0.152 and weighted average of 15.3%. Similarly, the statistical analysis conducted on geographies consisting of 357,675,141 people shows a strong positive correlation between the proportion of Immigrants from El Salvador and poverty level among females in the United States with a correlation coefficient (R) of 0.715 and weighted average of 15.7%, a difference of 2.5%.
Female Poverty Correlation Summary
| Measurement | Immigrants from Ghana | Immigrants from El Salvador |
| Minimum | 0.90% | 3.3% |
| Maximum | 43.0% | 100.0% |
| Range | 42.1% | 96.7% |
| Mean | 14.3% | 17.2% |
| Median | 13.3% | 14.8% |
| Interquartile 25% (IQ1) | 9.0% | 12.0% |
| Interquartile 75% (IQ3) | 17.8% | 18.3% |
| Interquartile Range (IQR) | 8.9% | 6.3% |
| Standard Deviation (Sample) | 8.1% | 11.7% |
| Standard Deviation (Population) | 8.0% | 11.6% |
Demographics Similar to Immigrants from Ghana and Immigrants from El Salvador by Female Poverty
In terms of female poverty, the demographic groups most similar to Immigrants from Ghana are Potawatomi (15.3%, a difference of 0.0%), Salvadoran (15.3%, a difference of 0.14%), Immigrants from Western Africa (15.3%, a difference of 0.18%), Immigrants from Trinidad and Tobago (15.4%, a difference of 0.34%), and Immigrants from Burma/Myanmar (15.4%, a difference of 0.37%). Similarly, the demographic groups most similar to Immigrants from El Salvador are Immigrants from Liberia (15.7%, a difference of 0.060%), Immigrants from Ecuador (15.6%, a difference of 0.36%), Subsaharan African (15.8%, a difference of 0.43%), Cherokee (15.6%, a difference of 0.49%), and Guyanese (15.6%, a difference of 0.50%).
| Demographics | Rating | Rank | Female Poverty |
| Potawatomi | 0.3 /100 | #247 | Tragic 15.3% |
| Immigrants | Ghana | 0.3 /100 | #248 | Tragic 15.3% |
| Salvadorans | 0.3 /100 | #249 | Tragic 15.3% |
| Immigrants | Western Africa | 0.3 /100 | #250 | Tragic 15.3% |
| Immigrants | Trinidad and Tobago | 0.3 /100 | #251 | Tragic 15.4% |
| Immigrants | Burma/Myanmar | 0.3 /100 | #252 | Tragic 15.4% |
| Liberians | 0.2 /100 | #253 | Tragic 15.4% |
| Trinidadians and Tobagonians | 0.2 /100 | #254 | Tragic 15.4% |
| Ottawa | 0.2 /100 | #255 | Tragic 15.5% |
| Jamaicans | 0.2 /100 | #256 | Tragic 15.5% |
| Immigrants | Jamaica | 0.1 /100 | #257 | Tragic 15.6% |
| Shoshone | 0.1 /100 | #258 | Tragic 15.6% |
| Cape Verdeans | 0.1 /100 | #259 | Tragic 15.6% |
| Immigrants | Guyana | 0.1 /100 | #260 | Tragic 15.6% |
| Guyanese | 0.1 /100 | #261 | Tragic 15.6% |
| Mexican American Indians | 0.1 /100 | #262 | Tragic 15.6% |
| Cherokee | 0.1 /100 | #263 | Tragic 15.6% |
| Immigrants | Ecuador | 0.1 /100 | #264 | Tragic 15.6% |
| Immigrants | Liberia | 0.1 /100 | #265 | Tragic 15.7% |
| Immigrants | El Salvador | 0.1 /100 | #266 | Tragic 15.7% |
| Sub-Saharan Africans | 0.1 /100 | #267 | Tragic 15.8% |