Pakistani vs Immigrants from El Salvador Female Poverty
COMPARE
Pakistani
Immigrants from El Salvador
Female Poverty
Female Poverty Comparison
Pakistanis
Immigrants from El Salvador
12.9%
FEMALE POVERTY
83.0/ 100
METRIC RATING
140th/ 347
METRIC RANK
15.7%
FEMALE POVERTY
0.1/ 100
METRIC RATING
266th/ 347
METRIC RANK
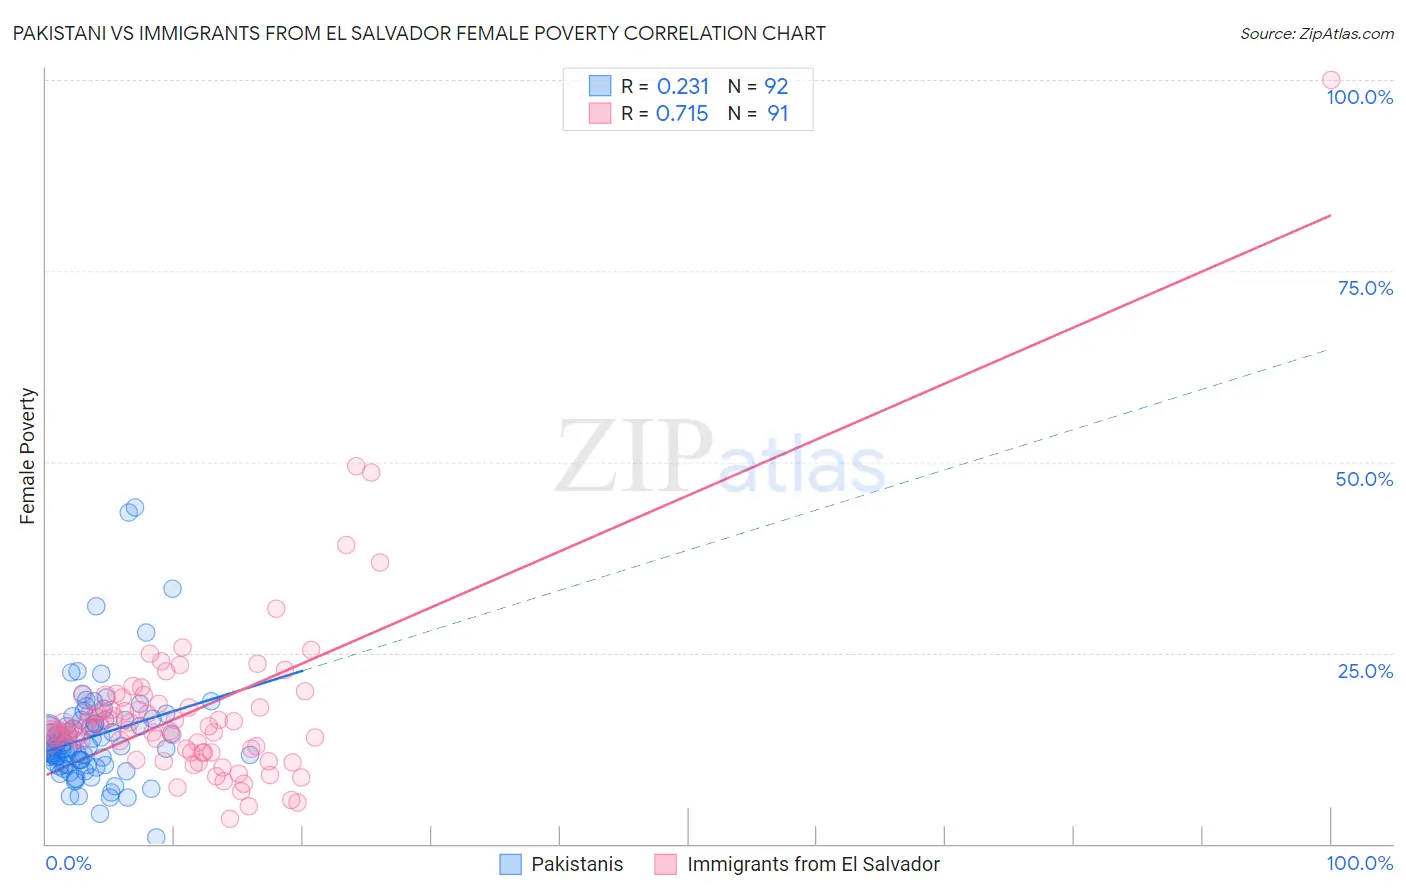
Pakistani vs Immigrants from El Salvador Female Poverty Correlation Chart
The statistical analysis conducted on geographies consisting of 335,177,271 people shows a weak positive correlation between the proportion of Pakistanis and poverty level among females in the United States with a correlation coefficient (R) of 0.231 and weighted average of 12.9%. Similarly, the statistical analysis conducted on geographies consisting of 357,675,141 people shows a strong positive correlation between the proportion of Immigrants from El Salvador and poverty level among females in the United States with a correlation coefficient (R) of 0.715 and weighted average of 15.7%, a difference of 21.3%.
Female Poverty Correlation Summary
| Measurement | Pakistani | Immigrants from El Salvador |
| Minimum | 0.74% | 3.3% |
| Maximum | 44.1% | 100.0% |
| Range | 43.3% | 96.7% |
| Mean | 14.0% | 17.2% |
| Median | 12.7% | 14.8% |
| Interquartile 25% (IQ1) | 10.3% | 12.0% |
| Interquartile 75% (IQ3) | 15.9% | 18.3% |
| Interquartile Range (IQR) | 5.6% | 6.3% |
| Standard Deviation (Sample) | 6.8% | 11.7% |
| Standard Deviation (Population) | 6.7% | 11.6% |
Similar Demographics by Female Poverty
Demographics Similar to Pakistanis by Female Poverty
In terms of female poverty, the demographic groups most similar to Pakistanis are Basque (12.9%, a difference of 0.010%), Immigrants from France (12.9%, a difference of 0.10%), Chilean (12.9%, a difference of 0.32%), Icelander (13.0%, a difference of 0.32%), and Peruvian (12.9%, a difference of 0.41%).
| Demographics | Rating | Rank | Female Poverty |
| Immigrants | Western Europe | 86.6 /100 | #133 | Excellent 12.8% |
| Immigrants | Switzerland | 85.8 /100 | #134 | Excellent 12.9% |
| French | 85.6 /100 | #135 | Excellent 12.9% |
| Peruvians | 85.2 /100 | #136 | Excellent 12.9% |
| Chileans | 84.7 /100 | #137 | Excellent 12.9% |
| Immigrants | France | 83.6 /100 | #138 | Excellent 12.9% |
| Basques | 83.1 /100 | #139 | Excellent 12.9% |
| Pakistanis | 83.0 /100 | #140 | Excellent 12.9% |
| Icelanders | 81.1 /100 | #141 | Excellent 13.0% |
| Brazilians | 80.5 /100 | #142 | Excellent 13.0% |
| Immigrants | Malaysia | 80.4 /100 | #143 | Excellent 13.0% |
| Afghans | 79.8 /100 | #144 | Good 13.0% |
| Syrians | 79.6 /100 | #145 | Good 13.0% |
| Immigrants | Peru | 79.1 /100 | #146 | Good 13.0% |
| Immigrants | Kazakhstan | 78.6 /100 | #147 | Good 13.0% |
Demographics Similar to Immigrants from El Salvador by Female Poverty
In terms of female poverty, the demographic groups most similar to Immigrants from El Salvador are Immigrants from Liberia (15.7%, a difference of 0.060%), Immigrants from Ecuador (15.6%, a difference of 0.36%), Subsaharan African (15.8%, a difference of 0.43%), Cherokee (15.6%, a difference of 0.49%), and Immigrants from Nicaragua (15.8%, a difference of 0.49%).
| Demographics | Rating | Rank | Female Poverty |
| Cape Verdeans | 0.1 /100 | #259 | Tragic 15.6% |
| Immigrants | Guyana | 0.1 /100 | #260 | Tragic 15.6% |
| Guyanese | 0.1 /100 | #261 | Tragic 15.6% |
| Mexican American Indians | 0.1 /100 | #262 | Tragic 15.6% |
| Cherokee | 0.1 /100 | #263 | Tragic 15.6% |
| Immigrants | Ecuador | 0.1 /100 | #264 | Tragic 15.6% |
| Immigrants | Liberia | 0.1 /100 | #265 | Tragic 15.7% |
| Immigrants | El Salvador | 0.1 /100 | #266 | Tragic 15.7% |
| Sub-Saharan Africans | 0.1 /100 | #267 | Tragic 15.8% |
| Immigrants | Nicaragua | 0.1 /100 | #268 | Tragic 15.8% |
| Iroquois | 0.1 /100 | #269 | Tragic 15.8% |
| Chickasaw | 0.1 /100 | #270 | Tragic 15.9% |
| Immigrants | St. Vincent and the Grenadines | 0.0 /100 | #271 | Tragic 15.9% |
| Belizeans | 0.0 /100 | #272 | Tragic 15.9% |
| Haitians | 0.0 /100 | #273 | Tragic 15.9% |