Carpatho Rusyn vs Immigrants from El Salvador Female Poverty
COMPARE
Carpatho Rusyn
Immigrants from El Salvador
Female Poverty
Female Poverty Comparison
Carpatho Rusyns
Immigrants from El Salvador
12.2%
FEMALE POVERTY
97.6/ 100
METRIC RATING
71st/ 347
METRIC RANK
15.7%
FEMALE POVERTY
0.1/ 100
METRIC RATING
266th/ 347
METRIC RANK
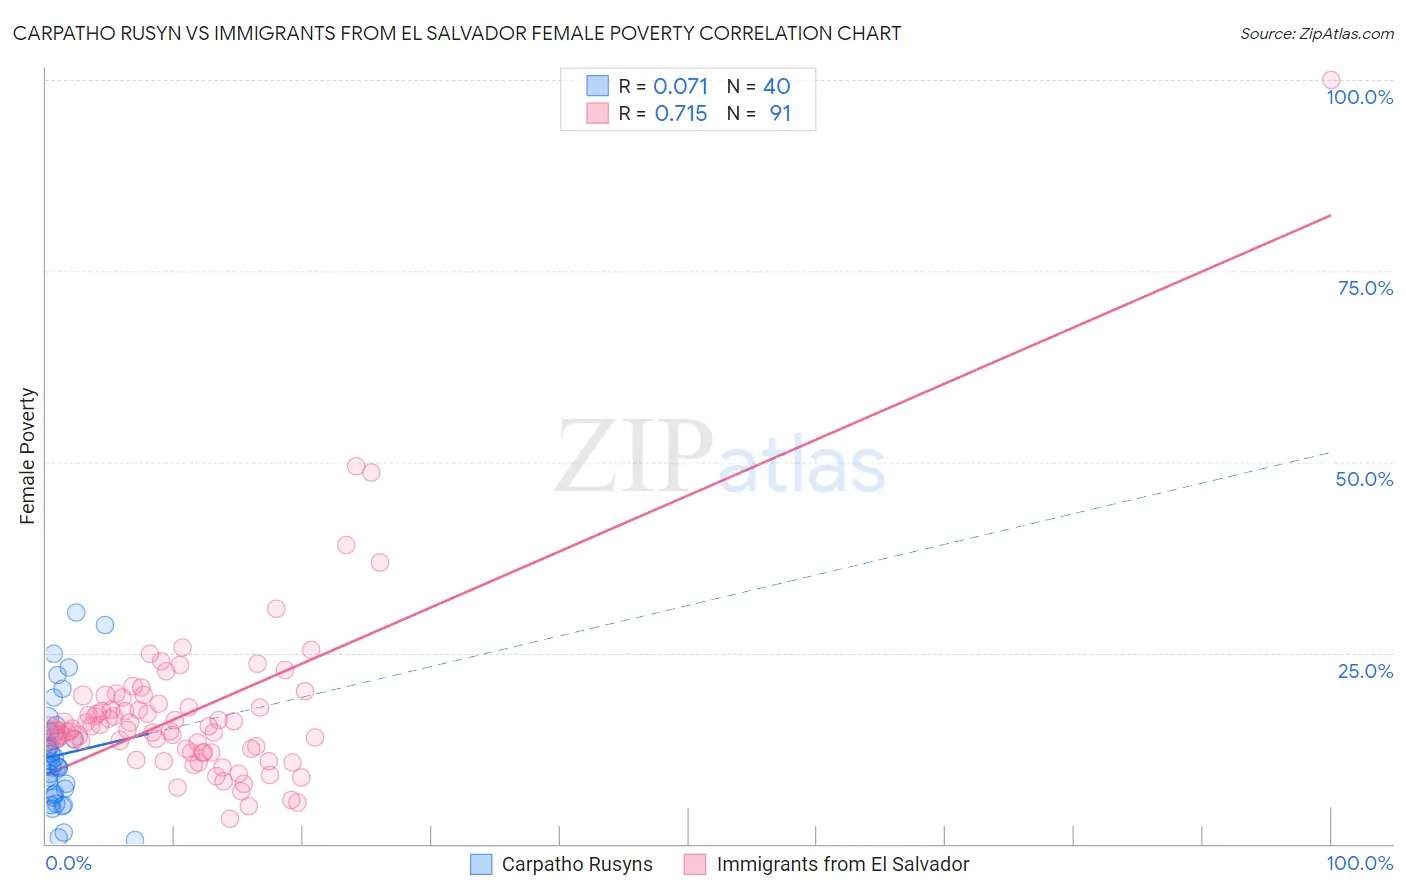
Carpatho Rusyn vs Immigrants from El Salvador Female Poverty Correlation Chart
The statistical analysis conducted on geographies consisting of 58,861,278 people shows a slight positive correlation between the proportion of Carpatho Rusyns and poverty level among females in the United States with a correlation coefficient (R) of 0.071 and weighted average of 12.2%. Similarly, the statistical analysis conducted on geographies consisting of 357,675,141 people shows a strong positive correlation between the proportion of Immigrants from El Salvador and poverty level among females in the United States with a correlation coefficient (R) of 0.715 and weighted average of 15.7%, a difference of 28.1%.
Female Poverty Correlation Summary
| Measurement | Carpatho Rusyn | Immigrants from El Salvador |
| Minimum | 0.50% | 3.3% |
| Maximum | 30.2% | 100.0% |
| Range | 29.7% | 96.7% |
| Mean | 11.6% | 17.2% |
| Median | 10.3% | 14.8% |
| Interquartile 25% (IQ1) | 6.5% | 12.0% |
| Interquartile 75% (IQ3) | 14.3% | 18.3% |
| Interquartile Range (IQR) | 7.8% | 6.3% |
| Standard Deviation (Sample) | 7.1% | 11.7% |
| Standard Deviation (Population) | 7.0% | 11.6% |
Similar Demographics by Female Poverty
Demographics Similar to Carpatho Rusyns by Female Poverty
In terms of female poverty, the demographic groups most similar to Carpatho Rusyns are Cambodian (12.2%, a difference of 0.030%), Zimbabwean (12.3%, a difference of 0.050%), Immigrants from Canada (12.3%, a difference of 0.060%), Immigrants from Belgium (12.2%, a difference of 0.13%), and Swiss (12.2%, a difference of 0.15%).
| Demographics | Rating | Rank | Female Poverty |
| Germans | 98.0 /100 | #64 | Exceptional 12.2% |
| Indians (Asian) | 97.9 /100 | #65 | Exceptional 12.2% |
| Austrians | 97.9 /100 | #66 | Exceptional 12.2% |
| Immigrants | Eastern Asia | 97.8 /100 | #67 | Exceptional 12.2% |
| Immigrants | Netherlands | 97.8 /100 | #68 | Exceptional 12.2% |
| Swiss | 97.7 /100 | #69 | Exceptional 12.2% |
| Immigrants | Belgium | 97.7 /100 | #70 | Exceptional 12.2% |
| Carpatho Rusyns | 97.6 /100 | #71 | Exceptional 12.2% |
| Cambodians | 97.5 /100 | #72 | Exceptional 12.2% |
| Zimbabweans | 97.5 /100 | #73 | Exceptional 12.3% |
| Immigrants | Canada | 97.5 /100 | #74 | Exceptional 12.3% |
| Europeans | 97.4 /100 | #75 | Exceptional 12.3% |
| Immigrants | Eastern Europe | 97.2 /100 | #76 | Exceptional 12.3% |
| Serbians | 97.2 /100 | #77 | Exceptional 12.3% |
| Egyptians | 97.2 /100 | #78 | Exceptional 12.3% |
Demographics Similar to Immigrants from El Salvador by Female Poverty
In terms of female poverty, the demographic groups most similar to Immigrants from El Salvador are Immigrants from Liberia (15.7%, a difference of 0.060%), Immigrants from Ecuador (15.6%, a difference of 0.36%), Subsaharan African (15.8%, a difference of 0.43%), Cherokee (15.6%, a difference of 0.49%), and Immigrants from Nicaragua (15.8%, a difference of 0.49%).
| Demographics | Rating | Rank | Female Poverty |
| Cape Verdeans | 0.1 /100 | #259 | Tragic 15.6% |
| Immigrants | Guyana | 0.1 /100 | #260 | Tragic 15.6% |
| Guyanese | 0.1 /100 | #261 | Tragic 15.6% |
| Mexican American Indians | 0.1 /100 | #262 | Tragic 15.6% |
| Cherokee | 0.1 /100 | #263 | Tragic 15.6% |
| Immigrants | Ecuador | 0.1 /100 | #264 | Tragic 15.6% |
| Immigrants | Liberia | 0.1 /100 | #265 | Tragic 15.7% |
| Immigrants | El Salvador | 0.1 /100 | #266 | Tragic 15.7% |
| Sub-Saharan Africans | 0.1 /100 | #267 | Tragic 15.8% |
| Immigrants | Nicaragua | 0.1 /100 | #268 | Tragic 15.8% |
| Iroquois | 0.1 /100 | #269 | Tragic 15.8% |
| Chickasaw | 0.1 /100 | #270 | Tragic 15.9% |
| Immigrants | St. Vincent and the Grenadines | 0.0 /100 | #271 | Tragic 15.9% |
| Belizeans | 0.0 /100 | #272 | Tragic 15.9% |
| Haitians | 0.0 /100 | #273 | Tragic 15.9% |