South African vs Immigrants from El Salvador Female Poverty
COMPARE
South African
Immigrants from El Salvador
Female Poverty
Female Poverty Comparison
South Africans
Immigrants from El Salvador
12.8%
FEMALE POVERTY
88.4/ 100
METRIC RATING
127th/ 347
METRIC RANK
15.7%
FEMALE POVERTY
0.1/ 100
METRIC RATING
266th/ 347
METRIC RANK
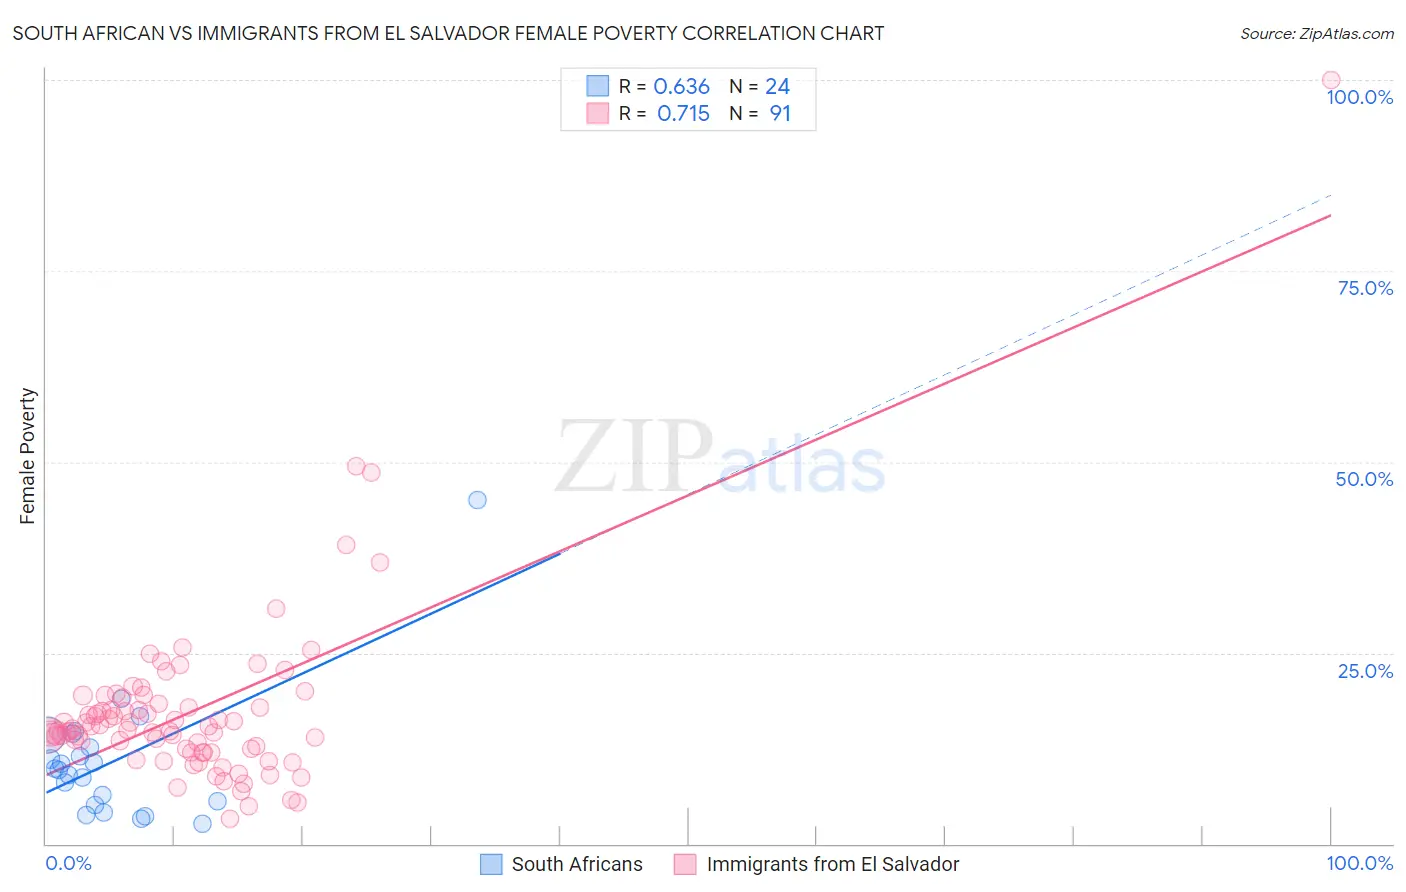
South African vs Immigrants from El Salvador Female Poverty Correlation Chart
The statistical analysis conducted on geographies consisting of 182,540,648 people shows a significant positive correlation between the proportion of South Africans and poverty level among females in the United States with a correlation coefficient (R) of 0.636 and weighted average of 12.8%. Similarly, the statistical analysis conducted on geographies consisting of 357,675,141 people shows a strong positive correlation between the proportion of Immigrants from El Salvador and poverty level among females in the United States with a correlation coefficient (R) of 0.715 and weighted average of 15.7%, a difference of 22.7%.
Female Poverty Correlation Summary
| Measurement | South African | Immigrants from El Salvador |
| Minimum | 2.6% | 3.3% |
| Maximum | 44.9% | 100.0% |
| Range | 42.4% | 96.7% |
| Mean | 10.8% | 17.2% |
| Median | 9.7% | 14.8% |
| Interquartile 25% (IQ1) | 5.3% | 12.0% |
| Interquartile 75% (IQ3) | 13.4% | 18.3% |
| Interquartile Range (IQR) | 8.1% | 6.3% |
| Standard Deviation (Sample) | 8.5% | 11.7% |
| Standard Deviation (Population) | 8.4% | 11.6% |
Similar Demographics by Female Poverty
Demographics Similar to South Africans by Female Poverty
In terms of female poverty, the demographic groups most similar to South Africans are Immigrants from Belarus (12.8%, a difference of 0.040%), Immigrants from Ukraine (12.8%, a difference of 0.11%), Immigrants from Brazil (12.8%, a difference of 0.11%), Argentinean (12.8%, a difference of 0.18%), and Immigrants from Norway (12.8%, a difference of 0.23%).
| Demographics | Rating | Rank | Female Poverty |
| New Zealanders | 90.6 /100 | #120 | Exceptional 12.7% |
| Immigrants | Hungary | 90.3 /100 | #121 | Exceptional 12.7% |
| French Canadians | 90.2 /100 | #122 | Exceptional 12.7% |
| Immigrants | South Eastern Asia | 89.9 /100 | #123 | Excellent 12.7% |
| Immigrants | Norway | 89.3 /100 | #124 | Excellent 12.8% |
| Argentineans | 89.1 /100 | #125 | Excellent 12.8% |
| Immigrants | Ukraine | 88.8 /100 | #126 | Excellent 12.8% |
| South Africans | 88.4 /100 | #127 | Excellent 12.8% |
| Immigrants | Belarus | 88.2 /100 | #128 | Excellent 12.8% |
| Immigrants | Brazil | 87.9 /100 | #129 | Excellent 12.8% |
| Immigrants | Vietnam | 87.1 /100 | #130 | Excellent 12.8% |
| Immigrants | Argentina | 87.0 /100 | #131 | Excellent 12.8% |
| Immigrants | Jordan | 86.9 /100 | #132 | Excellent 12.8% |
| Immigrants | Western Europe | 86.6 /100 | #133 | Excellent 12.8% |
| Immigrants | Switzerland | 85.8 /100 | #134 | Excellent 12.9% |
Demographics Similar to Immigrants from El Salvador by Female Poverty
In terms of female poverty, the demographic groups most similar to Immigrants from El Salvador are Immigrants from Liberia (15.7%, a difference of 0.060%), Immigrants from Ecuador (15.6%, a difference of 0.36%), Subsaharan African (15.8%, a difference of 0.43%), Cherokee (15.6%, a difference of 0.49%), and Immigrants from Nicaragua (15.8%, a difference of 0.49%).
| Demographics | Rating | Rank | Female Poverty |
| Cape Verdeans | 0.1 /100 | #259 | Tragic 15.6% |
| Immigrants | Guyana | 0.1 /100 | #260 | Tragic 15.6% |
| Guyanese | 0.1 /100 | #261 | Tragic 15.6% |
| Mexican American Indians | 0.1 /100 | #262 | Tragic 15.6% |
| Cherokee | 0.1 /100 | #263 | Tragic 15.6% |
| Immigrants | Ecuador | 0.1 /100 | #264 | Tragic 15.6% |
| Immigrants | Liberia | 0.1 /100 | #265 | Tragic 15.7% |
| Immigrants | El Salvador | 0.1 /100 | #266 | Tragic 15.7% |
| Sub-Saharan Africans | 0.1 /100 | #267 | Tragic 15.8% |
| Immigrants | Nicaragua | 0.1 /100 | #268 | Tragic 15.8% |
| Iroquois | 0.1 /100 | #269 | Tragic 15.8% |
| Chickasaw | 0.1 /100 | #270 | Tragic 15.9% |
| Immigrants | St. Vincent and the Grenadines | 0.0 /100 | #271 | Tragic 15.9% |
| Belizeans | 0.0 /100 | #272 | Tragic 15.9% |
| Haitians | 0.0 /100 | #273 | Tragic 15.9% |