Immigrants from Colombia vs Celtic Family Poverty
COMPARE
Immigrants from Colombia
Celtic
Family Poverty
Family Poverty Comparison
Immigrants from Colombia
Celtics
9.3%
FAMILY POVERTY
24.4/ 100
METRIC RATING
197th/ 347
METRIC RANK
8.8%
FAMILY POVERTY
64.9/ 100
METRIC RATING
164th/ 347
METRIC RANK
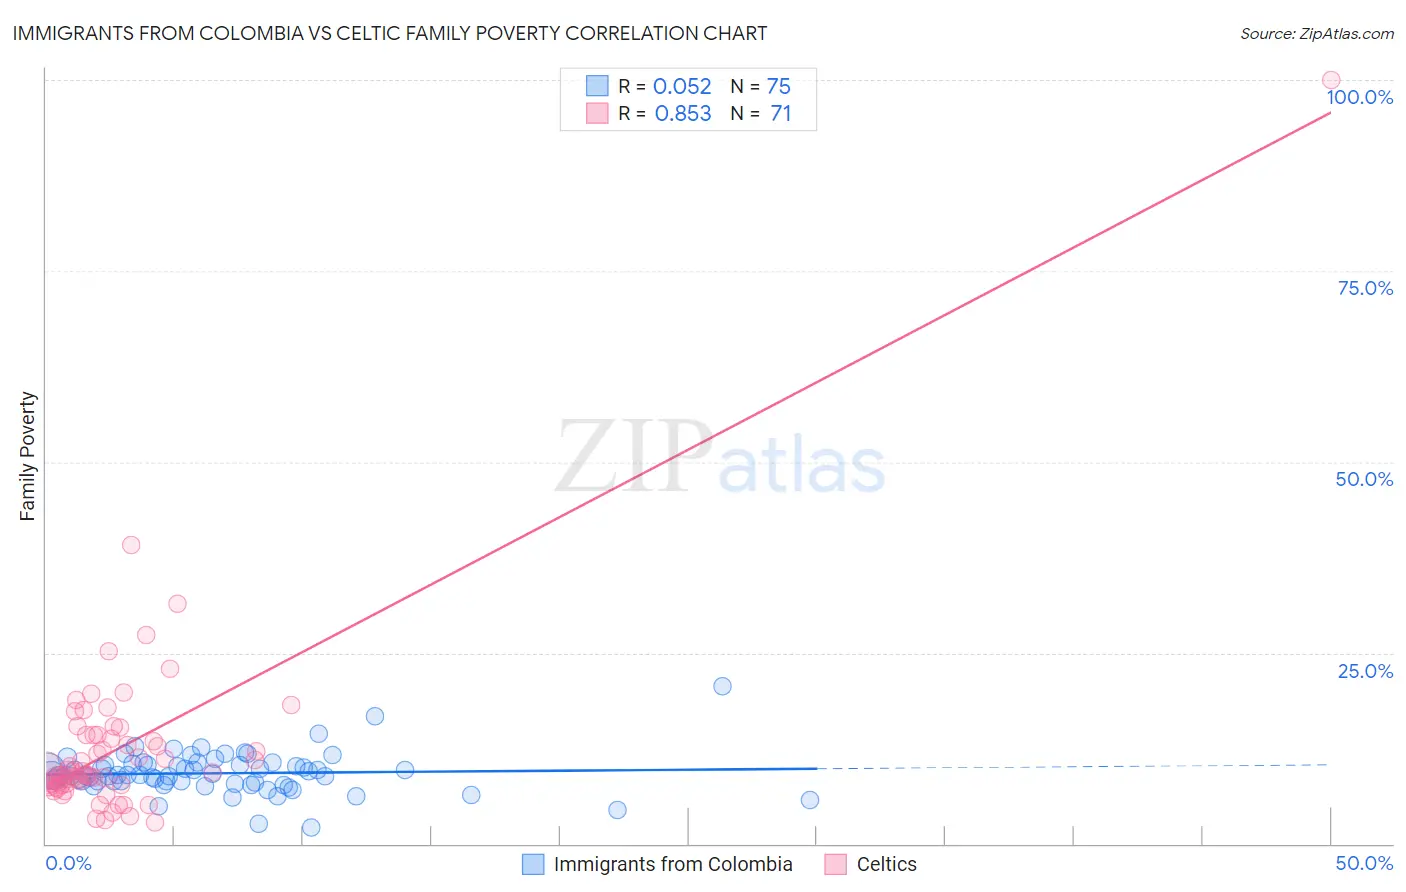
Immigrants from Colombia vs Celtic Family Poverty Correlation Chart
The statistical analysis conducted on geographies consisting of 377,791,823 people shows a slight positive correlation between the proportion of Immigrants from Colombia and poverty level among families in the United States with a correlation coefficient (R) of 0.052 and weighted average of 9.3%. Similarly, the statistical analysis conducted on geographies consisting of 168,628,915 people shows a very strong positive correlation between the proportion of Celtics and poverty level among families in the United States with a correlation coefficient (R) of 0.853 and weighted average of 8.8%, a difference of 5.8%.
Family Poverty Correlation Summary
| Measurement | Immigrants from Colombia | Celtic |
| Minimum | 2.1% | 2.8% |
| Maximum | 20.6% | 100.0% |
| Range | 18.5% | 97.2% |
| Mean | 9.2% | 12.7% |
| Median | 8.9% | 9.4% |
| Interquartile 25% (IQ1) | 8.1% | 7.6% |
| Interquartile 75% (IQ3) | 10.3% | 14.2% |
| Interquartile Range (IQR) | 2.3% | 6.6% |
| Standard Deviation (Sample) | 2.7% | 12.4% |
| Standard Deviation (Population) | 2.7% | 12.3% |
Similar Demographics by Family Poverty
Demographics Similar to Immigrants from Colombia by Family Poverty
In terms of family poverty, the demographic groups most similar to Immigrants from Colombia are Iraqi (9.3%, a difference of 0.030%), Spaniard (9.4%, a difference of 0.28%), Immigrants from Venezuela (9.3%, a difference of 0.29%), Immigrants from Costa Rica (9.4%, a difference of 0.47%), and Venezuelan (9.3%, a difference of 0.50%).
| Demographics | Rating | Rank | Family Poverty |
| Arabs | 31.5 /100 | #190 | Fair 9.2% |
| Ugandans | 28.7 /100 | #191 | Fair 9.3% |
| Spanish | 28.7 /100 | #192 | Fair 9.3% |
| Immigrants | Western Asia | 28.2 /100 | #193 | Fair 9.3% |
| South Americans | 28.1 /100 | #194 | Fair 9.3% |
| Venezuelans | 27.4 /100 | #195 | Fair 9.3% |
| Immigrants | Venezuela | 26.1 /100 | #196 | Fair 9.3% |
| Immigrants | Colombia | 24.4 /100 | #197 | Fair 9.3% |
| Iraqis | 24.2 /100 | #198 | Fair 9.3% |
| Spaniards | 22.8 /100 | #199 | Fair 9.4% |
| Immigrants | Costa Rica | 21.7 /100 | #200 | Fair 9.4% |
| Immigrants | Portugal | 20.5 /100 | #201 | Fair 9.4% |
| Immigrants | Sierra Leone | 19.6 /100 | #202 | Poor 9.4% |
| German Russians | 19.4 /100 | #203 | Poor 9.4% |
| Immigrants | Lebanon | 18.9 /100 | #204 | Poor 9.4% |
Demographics Similar to Celtics by Family Poverty
In terms of family poverty, the demographic groups most similar to Celtics are Guamanian/Chamorro (8.8%, a difference of 0.030%), Pennsylvania German (8.8%, a difference of 0.16%), Ethiopian (8.8%, a difference of 0.21%), Afghan (8.8%, a difference of 0.21%), and Immigrants from Northern Africa (8.8%, a difference of 0.30%).
| Demographics | Rating | Rank | Family Poverty |
| Tsimshian | 69.3 /100 | #157 | Good 8.8% |
| Whites/Caucasians | 69.1 /100 | #158 | Good 8.8% |
| Peruvians | 68.0 /100 | #159 | Good 8.8% |
| Hungarians | 67.2 /100 | #160 | Good 8.8% |
| Immigrants | Northern Africa | 66.9 /100 | #161 | Good 8.8% |
| Ethiopians | 66.3 /100 | #162 | Good 8.8% |
| Pennsylvania Germans | 66.0 /100 | #163 | Good 8.8% |
| Celtics | 64.9 /100 | #164 | Good 8.8% |
| Guamanians/Chamorros | 64.7 /100 | #165 | Good 8.8% |
| Afghans | 63.5 /100 | #166 | Good 8.8% |
| Immigrants | Ethiopia | 62.5 /100 | #167 | Good 8.9% |
| Israelis | 62.1 /100 | #168 | Good 8.9% |
| Immigrants | Chile | 59.6 /100 | #169 | Average 8.9% |
| Kenyans | 58.2 /100 | #170 | Average 8.9% |
| Lebanese | 57.6 /100 | #171 | Average 8.9% |