Immigrants from Colombia vs Sioux Family Poverty
COMPARE
Immigrants from Colombia
Sioux
Family Poverty
Family Poverty Comparison
Immigrants from Colombia
Sioux
9.3%
FAMILY POVERTY
24.4/ 100
METRIC RATING
197th/ 347
METRIC RANK
15.9%
FAMILY POVERTY
0.0/ 100
METRIC RATING
336th/ 347
METRIC RANK
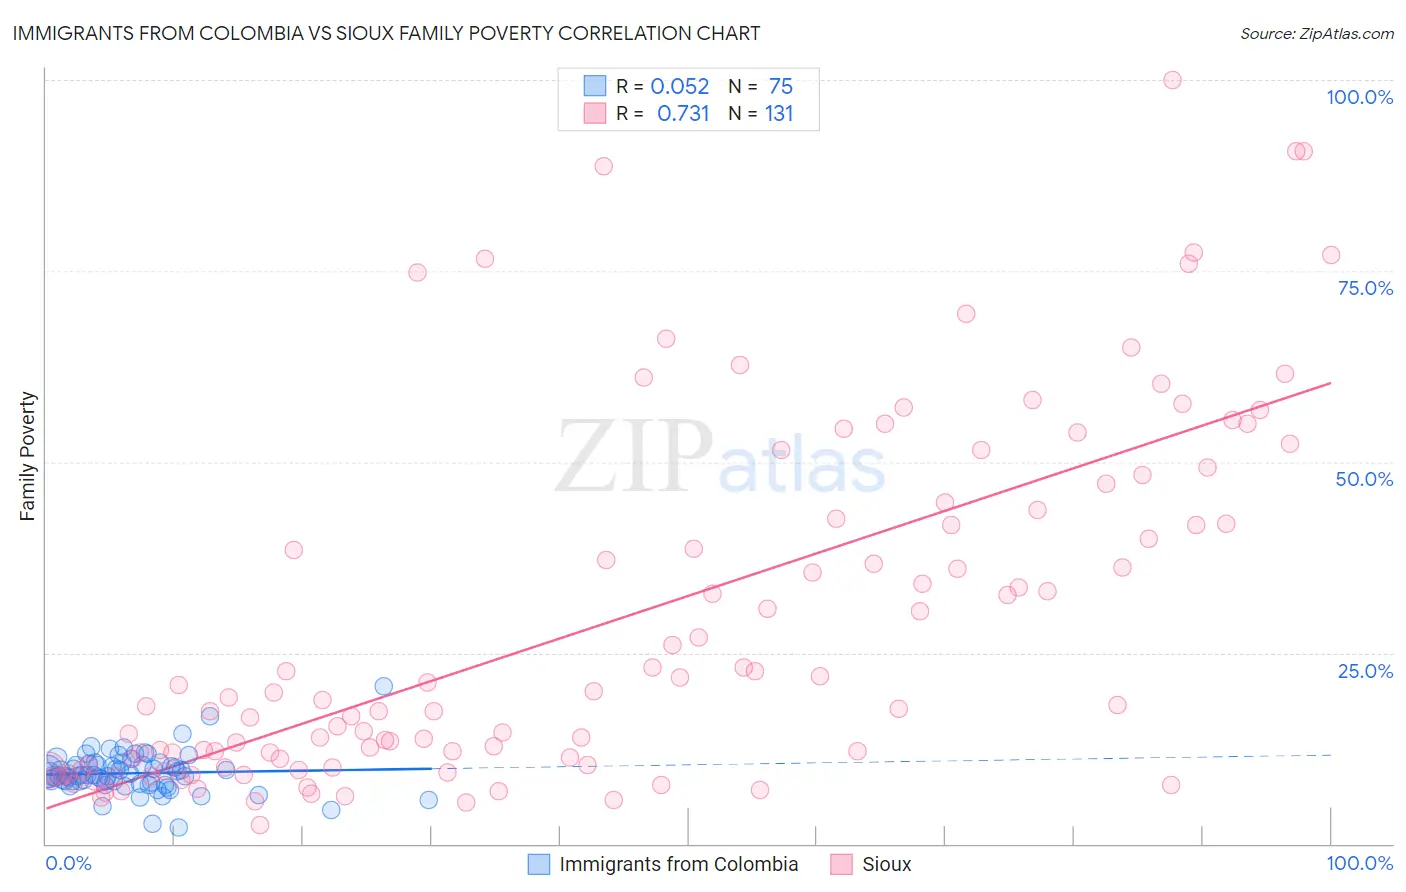
Immigrants from Colombia vs Sioux Family Poverty Correlation Chart
The statistical analysis conducted on geographies consisting of 377,791,823 people shows a slight positive correlation between the proportion of Immigrants from Colombia and poverty level among families in the United States with a correlation coefficient (R) of 0.052 and weighted average of 9.3%. Similarly, the statistical analysis conducted on geographies consisting of 233,799,830 people shows a strong positive correlation between the proportion of Sioux and poverty level among families in the United States with a correlation coefficient (R) of 0.731 and weighted average of 15.9%, a difference of 69.7%.
Family Poverty Correlation Summary
| Measurement | Immigrants from Colombia | Sioux |
| Minimum | 2.1% | 2.5% |
| Maximum | 20.6% | 100.0% |
| Range | 18.5% | 97.5% |
| Mean | 9.2% | 29.0% |
| Median | 8.9% | 18.8% |
| Interquartile 25% (IQ1) | 8.1% | 10.3% |
| Interquartile 75% (IQ3) | 10.3% | 43.6% |
| Interquartile Range (IQR) | 2.3% | 33.4% |
| Standard Deviation (Sample) | 2.7% | 23.2% |
| Standard Deviation (Population) | 2.7% | 23.1% |
Similar Demographics by Family Poverty
Demographics Similar to Immigrants from Colombia by Family Poverty
In terms of family poverty, the demographic groups most similar to Immigrants from Colombia are Iraqi (9.3%, a difference of 0.030%), Spaniard (9.4%, a difference of 0.28%), Immigrants from Venezuela (9.3%, a difference of 0.29%), Immigrants from Costa Rica (9.4%, a difference of 0.47%), and Venezuelan (9.3%, a difference of 0.50%).
| Demographics | Rating | Rank | Family Poverty |
| Arabs | 31.5 /100 | #190 | Fair 9.2% |
| Ugandans | 28.7 /100 | #191 | Fair 9.3% |
| Spanish | 28.7 /100 | #192 | Fair 9.3% |
| Immigrants | Western Asia | 28.2 /100 | #193 | Fair 9.3% |
| South Americans | 28.1 /100 | #194 | Fair 9.3% |
| Venezuelans | 27.4 /100 | #195 | Fair 9.3% |
| Immigrants | Venezuela | 26.1 /100 | #196 | Fair 9.3% |
| Immigrants | Colombia | 24.4 /100 | #197 | Fair 9.3% |
| Iraqis | 24.2 /100 | #198 | Fair 9.3% |
| Spaniards | 22.8 /100 | #199 | Fair 9.4% |
| Immigrants | Costa Rica | 21.7 /100 | #200 | Fair 9.4% |
| Immigrants | Portugal | 20.5 /100 | #201 | Fair 9.4% |
| Immigrants | Sierra Leone | 19.6 /100 | #202 | Poor 9.4% |
| German Russians | 19.4 /100 | #203 | Poor 9.4% |
| Immigrants | Lebanon | 18.9 /100 | #204 | Poor 9.4% |
Demographics Similar to Sioux by Family Poverty
In terms of family poverty, the demographic groups most similar to Sioux are Hopi (15.9%, a difference of 0.47%), Crow (16.1%, a difference of 1.6%), Yuman (16.6%, a difference of 5.0%), Pueblo (17.0%, a difference of 7.1%), and Lumbee (17.0%, a difference of 7.2%).
| Demographics | Rating | Rank | Family Poverty |
| Blacks/African Americans | 0.0 /100 | #329 | Tragic 13.3% |
| Natives/Alaskans | 0.0 /100 | #330 | Tragic 14.3% |
| Cheyenne | 0.0 /100 | #331 | Tragic 14.3% |
| Dominicans | 0.0 /100 | #332 | Tragic 14.3% |
| Immigrants | Dominican Republic | 0.0 /100 | #333 | Tragic 14.4% |
| Houma | 0.0 /100 | #334 | Tragic 14.6% |
| Apache | 0.0 /100 | #335 | Tragic 14.7% |
| Sioux | 0.0 /100 | #336 | Tragic 15.9% |
| Hopi | 0.0 /100 | #337 | Tragic 15.9% |
| Crow | 0.0 /100 | #338 | Tragic 16.1% |
| Yuman | 0.0 /100 | #339 | Tragic 16.6% |
| Pueblo | 0.0 /100 | #340 | Tragic 17.0% |
| Lumbee | 0.0 /100 | #341 | Tragic 17.0% |
| Immigrants | Yemen | 0.0 /100 | #342 | Tragic 17.5% |
| Pima | 0.0 /100 | #343 | Tragic 18.4% |