Immigrants from Colombia vs Greek Family Poverty
COMPARE
Immigrants from Colombia
Greek
Family Poverty
Family Poverty Comparison
Immigrants from Colombia
Greeks
9.3%
FAMILY POVERTY
24.4/ 100
METRIC RATING
197th/ 347
METRIC RANK
7.5%
FAMILY POVERTY
99.4/ 100
METRIC RATING
35th/ 347
METRIC RANK
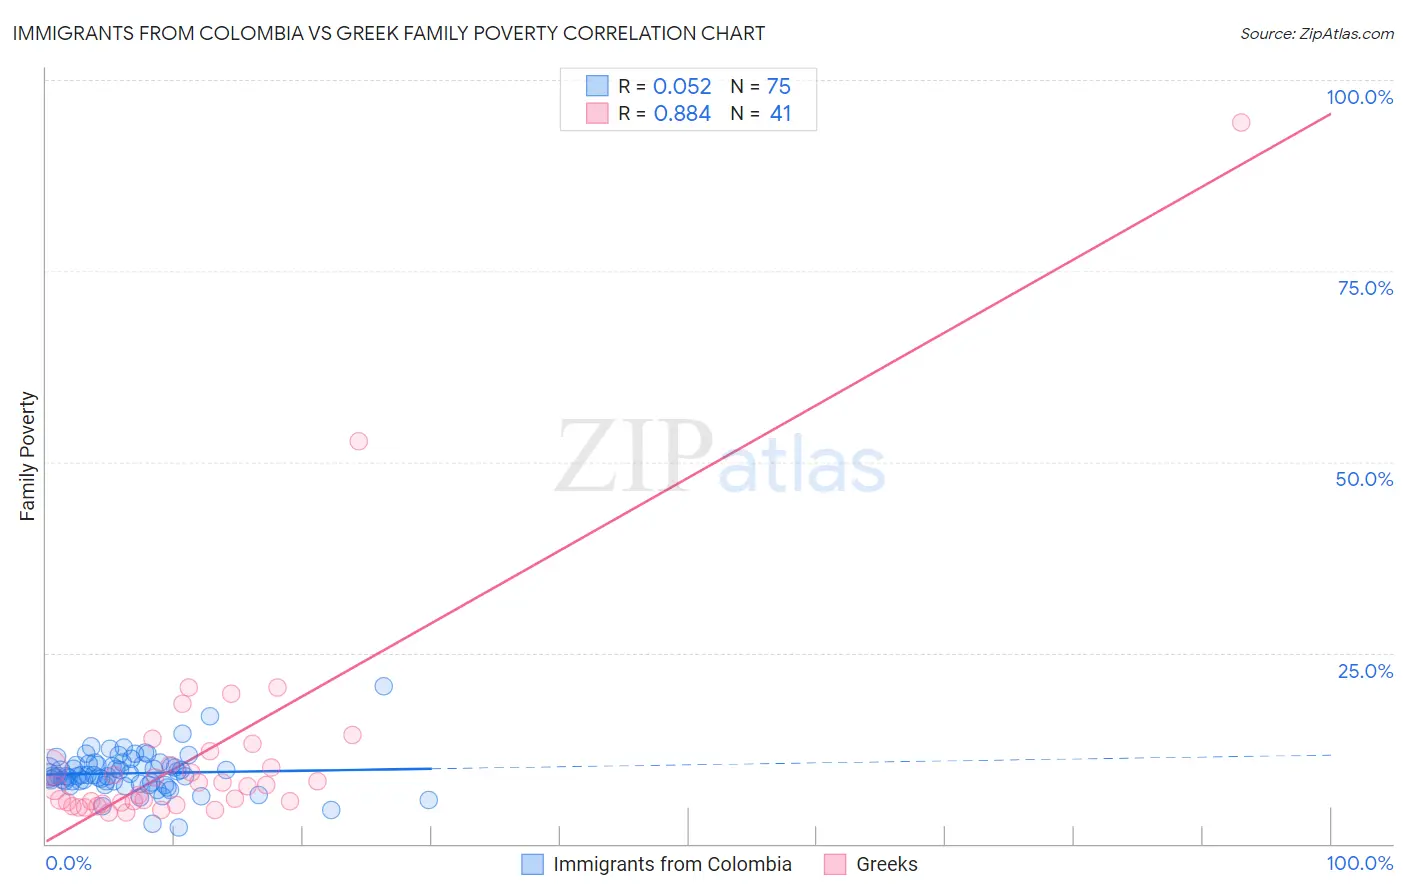
Immigrants from Colombia vs Greek Family Poverty Correlation Chart
The statistical analysis conducted on geographies consisting of 377,791,823 people shows a slight positive correlation between the proportion of Immigrants from Colombia and poverty level among families in the United States with a correlation coefficient (R) of 0.052 and weighted average of 9.3%. Similarly, the statistical analysis conducted on geographies consisting of 480,426,664 people shows a very strong positive correlation between the proportion of Greeks and poverty level among families in the United States with a correlation coefficient (R) of 0.884 and weighted average of 7.5%, a difference of 24.4%.
Family Poverty Correlation Summary
| Measurement | Immigrants from Colombia | Greek |
| Minimum | 2.1% | 4.1% |
| Maximum | 20.6% | 94.4% |
| Range | 18.5% | 90.3% |
| Mean | 9.2% | 11.7% |
| Median | 8.9% | 7.5% |
| Interquartile 25% (IQ1) | 8.1% | 5.3% |
| Interquartile 75% (IQ3) | 10.3% | 11.2% |
| Interquartile Range (IQR) | 2.3% | 5.9% |
| Standard Deviation (Sample) | 2.7% | 15.6% |
| Standard Deviation (Population) | 2.7% | 15.4% |
Similar Demographics by Family Poverty
Demographics Similar to Immigrants from Colombia by Family Poverty
In terms of family poverty, the demographic groups most similar to Immigrants from Colombia are Iraqi (9.3%, a difference of 0.030%), Spaniard (9.4%, a difference of 0.28%), Immigrants from Venezuela (9.3%, a difference of 0.29%), Immigrants from Costa Rica (9.4%, a difference of 0.47%), and Venezuelan (9.3%, a difference of 0.50%).
| Demographics | Rating | Rank | Family Poverty |
| Arabs | 31.5 /100 | #190 | Fair 9.2% |
| Ugandans | 28.7 /100 | #191 | Fair 9.3% |
| Spanish | 28.7 /100 | #192 | Fair 9.3% |
| Immigrants | Western Asia | 28.2 /100 | #193 | Fair 9.3% |
| South Americans | 28.1 /100 | #194 | Fair 9.3% |
| Venezuelans | 27.4 /100 | #195 | Fair 9.3% |
| Immigrants | Venezuela | 26.1 /100 | #196 | Fair 9.3% |
| Immigrants | Colombia | 24.4 /100 | #197 | Fair 9.3% |
| Iraqis | 24.2 /100 | #198 | Fair 9.3% |
| Spaniards | 22.8 /100 | #199 | Fair 9.4% |
| Immigrants | Costa Rica | 21.7 /100 | #200 | Fair 9.4% |
| Immigrants | Portugal | 20.5 /100 | #201 | Fair 9.4% |
| Immigrants | Sierra Leone | 19.6 /100 | #202 | Poor 9.4% |
| German Russians | 19.4 /100 | #203 | Poor 9.4% |
| Immigrants | Lebanon | 18.9 /100 | #204 | Poor 9.4% |
Demographics Similar to Greeks by Family Poverty
In terms of family poverty, the demographic groups most similar to Greeks are Turkish (7.5%, a difference of 0.010%), Estonian (7.5%, a difference of 0.18%), Bolivian (7.5%, a difference of 0.43%), Carpatho Rusyn (7.5%, a difference of 0.49%), and Slovene (7.5%, a difference of 0.52%).
| Demographics | Rating | Rank | Family Poverty |
| Immigrants | Korea | 99.6 /100 | #28 | Exceptional 7.4% |
| Immigrants | Northern Europe | 99.6 /100 | #29 | Exceptional 7.4% |
| Italians | 99.6 /100 | #30 | Exceptional 7.4% |
| Czechs | 99.6 /100 | #31 | Exceptional 7.4% |
| Poles | 99.5 /100 | #32 | Exceptional 7.4% |
| Immigrants | Japan | 99.5 /100 | #33 | Exceptional 7.4% |
| Russians | 99.5 /100 | #34 | Exceptional 7.5% |
| Greeks | 99.4 /100 | #35 | Exceptional 7.5% |
| Turks | 99.4 /100 | #36 | Exceptional 7.5% |
| Estonians | 99.4 /100 | #37 | Exceptional 7.5% |
| Bolivians | 99.3 /100 | #38 | Exceptional 7.5% |
| Carpatho Rusyns | 99.3 /100 | #39 | Exceptional 7.5% |
| Slovenes | 99.3 /100 | #40 | Exceptional 7.5% |
| Immigrants | Australia | 99.2 /100 | #41 | Exceptional 7.6% |
| Scandinavians | 99.1 /100 | #42 | Exceptional 7.6% |