Immigrants from China vs Mexican American Indian GED/Equivalency
COMPARE
Immigrants from China
Mexican American Indian
GED/Equivalency
GED/Equivalency Comparison
Immigrants from China
Mexican American Indians
86.9%
GED/EQUIVALENCY
93.2/ 100
METRIC RATING
119th/ 347
METRIC RANK
79.4%
GED/EQUIVALENCY
0.0/ 100
METRIC RATING
324th/ 347
METRIC RANK
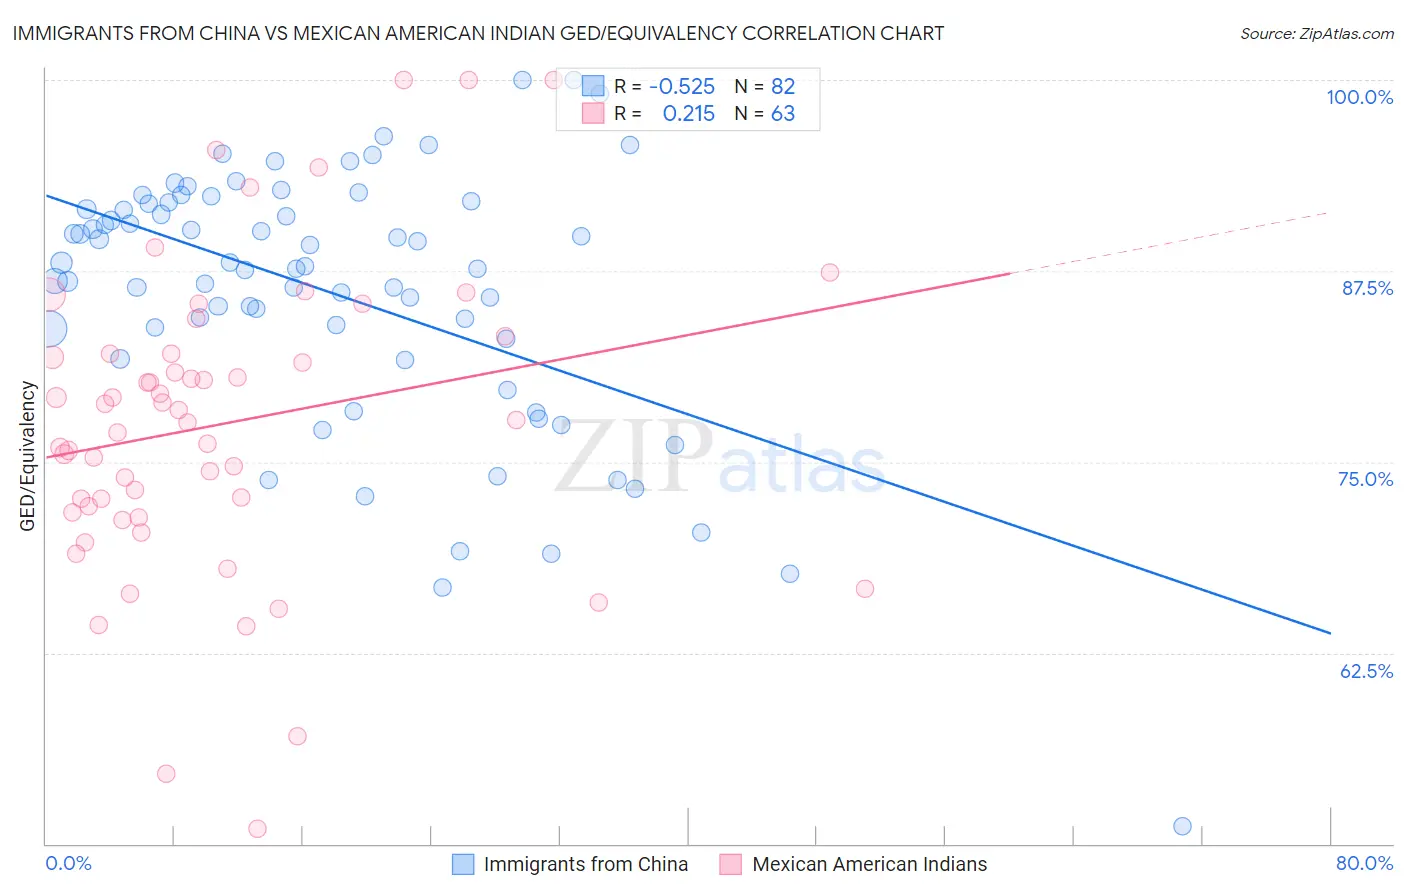
Immigrants from China vs Mexican American Indian GED/Equivalency Correlation Chart
The statistical analysis conducted on geographies consisting of 457,082,738 people shows a substantial negative correlation between the proportion of Immigrants from China and percentage of population with at least ged/equivalency education in the United States with a correlation coefficient (R) of -0.525 and weighted average of 86.9%. Similarly, the statistical analysis conducted on geographies consisting of 317,621,155 people shows a weak positive correlation between the proportion of Mexican American Indians and percentage of population with at least ged/equivalency education in the United States with a correlation coefficient (R) of 0.215 and weighted average of 79.4%, a difference of 9.5%.
GED/Equivalency Correlation Summary
| Measurement | Immigrants from China | Mexican American Indian |
| Minimum | 51.2% | 51.0% |
| Maximum | 100.0% | 100.0% |
| Range | 48.8% | 49.0% |
| Mean | 86.0% | 77.5% |
| Median | 87.7% | 77.8% |
| Interquartile 25% (IQ1) | 83.1% | 71.7% |
| Interquartile 75% (IQ3) | 91.9% | 82.1% |
| Interquartile Range (IQR) | 8.8% | 10.4% |
| Standard Deviation (Sample) | 8.6% | 10.0% |
| Standard Deviation (Population) | 8.6% | 9.9% |
Similar Demographics by GED/Equivalency
Demographics Similar to Immigrants from China by GED/Equivalency
In terms of ged/equivalency, the demographic groups most similar to Immigrants from China are French Canadian (86.9%, a difference of 0.0%), Immigrants from Hong Kong (86.9%, a difference of 0.050%), Swiss (87.0%, a difference of 0.12%), Scotch-Irish (86.8%, a difference of 0.12%), and Immigrants from Kazakhstan (87.0%, a difference of 0.13%).
| Demographics | Rating | Rank | GED/Equivalency |
| Tlingit-Haida | 94.8 /100 | #112 | Exceptional 87.0% |
| Assyrians/Chaldeans/Syriacs | 94.8 /100 | #113 | Exceptional 87.0% |
| Immigrants | Kazakhstan | 94.7 /100 | #114 | Exceptional 87.0% |
| Mongolians | 94.6 /100 | #115 | Exceptional 87.0% |
| Swiss | 94.5 /100 | #116 | Exceptional 87.0% |
| Immigrants | Hong Kong | 93.8 /100 | #117 | Exceptional 86.9% |
| French Canadians | 93.2 /100 | #118 | Exceptional 86.9% |
| Immigrants | China | 93.2 /100 | #119 | Exceptional 86.9% |
| Scotch-Irish | 91.6 /100 | #120 | Exceptional 86.8% |
| Immigrants | Lebanon | 90.9 /100 | #121 | Exceptional 86.8% |
| Immigrants | Jordan | 90.8 /100 | #122 | Exceptional 86.8% |
| Immigrants | Italy | 90.5 /100 | #123 | Exceptional 86.7% |
| Immigrants | Egypt | 90.4 /100 | #124 | Exceptional 86.7% |
| Celtics | 90.4 /100 | #125 | Exceptional 86.7% |
| Asians | 90.3 /100 | #126 | Exceptional 86.7% |
Demographics Similar to Mexican American Indians by GED/Equivalency
In terms of ged/equivalency, the demographic groups most similar to Mexican American Indians are Honduran (79.3%, a difference of 0.12%), Yuman (79.2%, a difference of 0.21%), Central American (79.2%, a difference of 0.23%), Hispanic or Latino (79.1%, a difference of 0.34%), and Dominican (79.1%, a difference of 0.38%).
| Demographics | Rating | Rank | GED/Equivalency |
| Immigrants | Caribbean | 0.0 /100 | #317 | Tragic 80.5% |
| Yaqui | 0.0 /100 | #318 | Tragic 80.5% |
| Immigrants | Belize | 0.0 /100 | #319 | Tragic 80.5% |
| Immigrants | Cuba | 0.0 /100 | #320 | Tragic 80.2% |
| Yup'ik | 0.0 /100 | #321 | Tragic 80.0% |
| Lumbee | 0.0 /100 | #322 | Tragic 80.0% |
| Immigrants | Nicaragua | 0.0 /100 | #323 | Tragic 79.9% |
| Mexican American Indians | 0.0 /100 | #324 | Tragic 79.4% |
| Hondurans | 0.0 /100 | #325 | Tragic 79.3% |
| Yuman | 0.0 /100 | #326 | Tragic 79.2% |
| Central Americans | 0.0 /100 | #327 | Tragic 79.2% |
| Hispanics or Latinos | 0.0 /100 | #328 | Tragic 79.1% |
| Dominicans | 0.0 /100 | #329 | Tragic 79.1% |
| Immigrants | Cabo Verde | 0.0 /100 | #330 | Tragic 78.9% |
| Immigrants | Honduras | 0.0 /100 | #331 | Tragic 78.7% |