Immigrants from Hong Kong vs Mexican American Indian Poverty
COMPARE
Immigrants from Hong Kong
Mexican American Indian
Poverty
Poverty Comparison
Immigrants from Hong Kong
Mexican American Indians
10.4%
POVERTY
99.8/ 100
METRIC RATING
13th/ 347
METRIC RANK
14.3%
POVERTY
0.1/ 100
METRIC RATING
256th/ 347
METRIC RANK
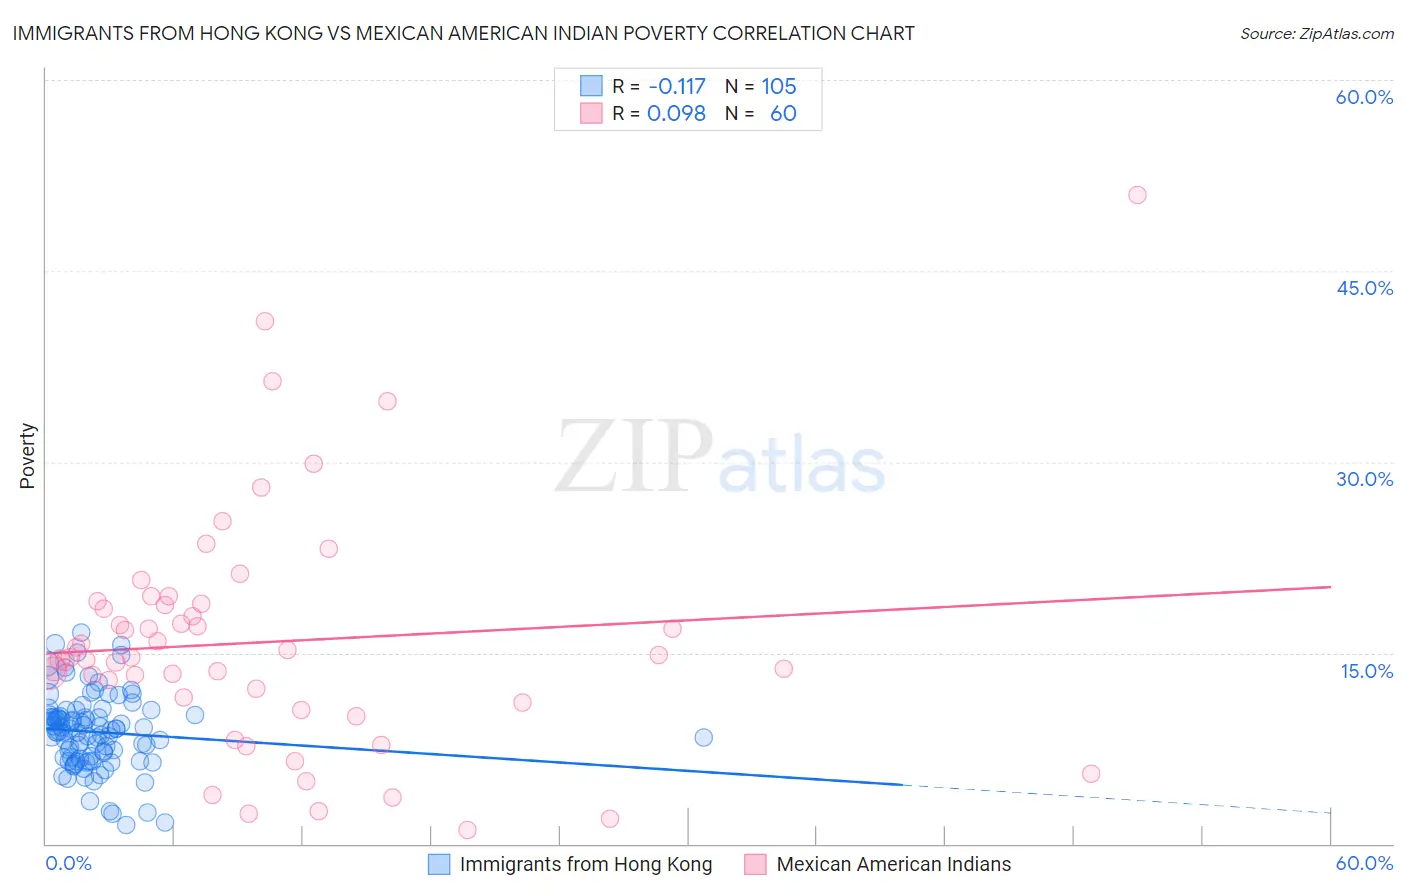
Immigrants from Hong Kong vs Mexican American Indian Poverty Correlation Chart
The statistical analysis conducted on geographies consisting of 253,892,762 people shows a poor negative correlation between the proportion of Immigrants from Hong Kong and poverty level in the United States with a correlation coefficient (R) of -0.117 and weighted average of 10.4%. Similarly, the statistical analysis conducted on geographies consisting of 317,505,642 people shows a slight positive correlation between the proportion of Mexican American Indians and poverty level in the United States with a correlation coefficient (R) of 0.098 and weighted average of 14.3%, a difference of 37.4%.
Poverty Correlation Summary
| Measurement | Immigrants from Hong Kong | Mexican American Indian |
| Minimum | 1.5% | 1.1% |
| Maximum | 16.6% | 51.0% |
| Range | 15.1% | 49.9% |
| Mean | 8.8% | 15.9% |
| Median | 8.9% | 14.6% |
| Interquartile 25% (IQ1) | 6.7% | 11.3% |
| Interquartile 75% (IQ3) | 10.1% | 18.8% |
| Interquartile Range (IQR) | 3.4% | 7.5% |
| Standard Deviation (Sample) | 3.0% | 9.3% |
| Standard Deviation (Population) | 3.0% | 9.2% |
Similar Demographics by Poverty
Demographics Similar to Immigrants from Hong Kong by Poverty
In terms of poverty, the demographic groups most similar to Immigrants from Hong Kong are Bhutanese (10.4%, a difference of 0.22%), Immigrants from Bolivia (10.4%, a difference of 0.31%), Bolivian (10.4%, a difference of 0.32%), Immigrants from Lithuania (10.3%, a difference of 0.57%), and Lithuanian (10.5%, a difference of 0.62%).
| Demographics | Rating | Rank | Poverty |
| Assyrians/Chaldeans/Syriacs | 99.9 /100 | #6 | Exceptional 10.1% |
| Filipinos | 99.9 /100 | #7 | Exceptional 10.1% |
| Maltese | 99.9 /100 | #8 | Exceptional 10.2% |
| Immigrants | South Central Asia | 99.9 /100 | #9 | Exceptional 10.2% |
| Bulgarians | 99.9 /100 | #10 | Exceptional 10.2% |
| Immigrants | Lithuania | 99.9 /100 | #11 | Exceptional 10.3% |
| Bhutanese | 99.8 /100 | #12 | Exceptional 10.4% |
| Immigrants | Hong Kong | 99.8 /100 | #13 | Exceptional 10.4% |
| Immigrants | Bolivia | 99.8 /100 | #14 | Exceptional 10.4% |
| Bolivians | 99.8 /100 | #15 | Exceptional 10.4% |
| Lithuanians | 99.8 /100 | #16 | Exceptional 10.5% |
| Norwegians | 99.8 /100 | #17 | Exceptional 10.5% |
| Latvians | 99.8 /100 | #18 | Exceptional 10.5% |
| Immigrants | Scotland | 99.7 /100 | #19 | Exceptional 10.6% |
| Immigrants | North Macedonia | 99.7 /100 | #20 | Exceptional 10.6% |
Demographics Similar to Mexican American Indians by Poverty
In terms of poverty, the demographic groups most similar to Mexican American Indians are Immigrants from Ecuador (14.3%, a difference of 0.020%), Trinidadian and Tobagonian (14.3%, a difference of 0.040%), Ottawa (14.3%, a difference of 0.050%), Immigrants from El Salvador (14.3%, a difference of 0.11%), and Immigrants from Nicaragua (14.3%, a difference of 0.32%).
| Demographics | Rating | Rank | Poverty |
| Immigrants | Ghana | 0.2 /100 | #249 | Tragic 14.2% |
| Cree | 0.2 /100 | #250 | Tragic 14.2% |
| Immigrants | Burma/Myanmar | 0.2 /100 | #251 | Tragic 14.2% |
| Spanish American Indians | 0.2 /100 | #252 | Tragic 14.2% |
| Immigrants | Trinidad and Tobago | 0.2 /100 | #253 | Tragic 14.2% |
| Immigrants | El Salvador | 0.1 /100 | #254 | Tragic 14.3% |
| Immigrants | Ecuador | 0.1 /100 | #255 | Tragic 14.3% |
| Mexican American Indians | 0.1 /100 | #256 | Tragic 14.3% |
| Trinidadians and Tobagonians | 0.1 /100 | #257 | Tragic 14.3% |
| Ottawa | 0.1 /100 | #258 | Tragic 14.3% |
| Immigrants | Nicaragua | 0.1 /100 | #259 | Tragic 14.3% |
| Cape Verdeans | 0.1 /100 | #260 | Tragic 14.4% |
| Cherokee | 0.1 /100 | #261 | Tragic 14.4% |
| Immigrants | Liberia | 0.1 /100 | #262 | Tragic 14.4% |
| Jamaicans | 0.1 /100 | #263 | Tragic 14.4% |