Immigrants from China vs Hispanic or Latino Unemployment Among Ages 35 to 44 years
COMPARE
Immigrants from China
Hispanic or Latino
Unemployment Among Ages 35 to 44 years
Unemployment Among Ages 35 to 44 years Comparison
Immigrants from China
Hispanics or Latinos
4.4%
UNEMPLOYMENT AMONG AGES 35 TO 44 YEARS
96.7/ 100
METRIC RATING
70th/ 347
METRIC RANK
5.5%
UNEMPLOYMENT AMONG AGES 35 TO 44 YEARS
0.0/ 100
METRIC RATING
285th/ 347
METRIC RANK
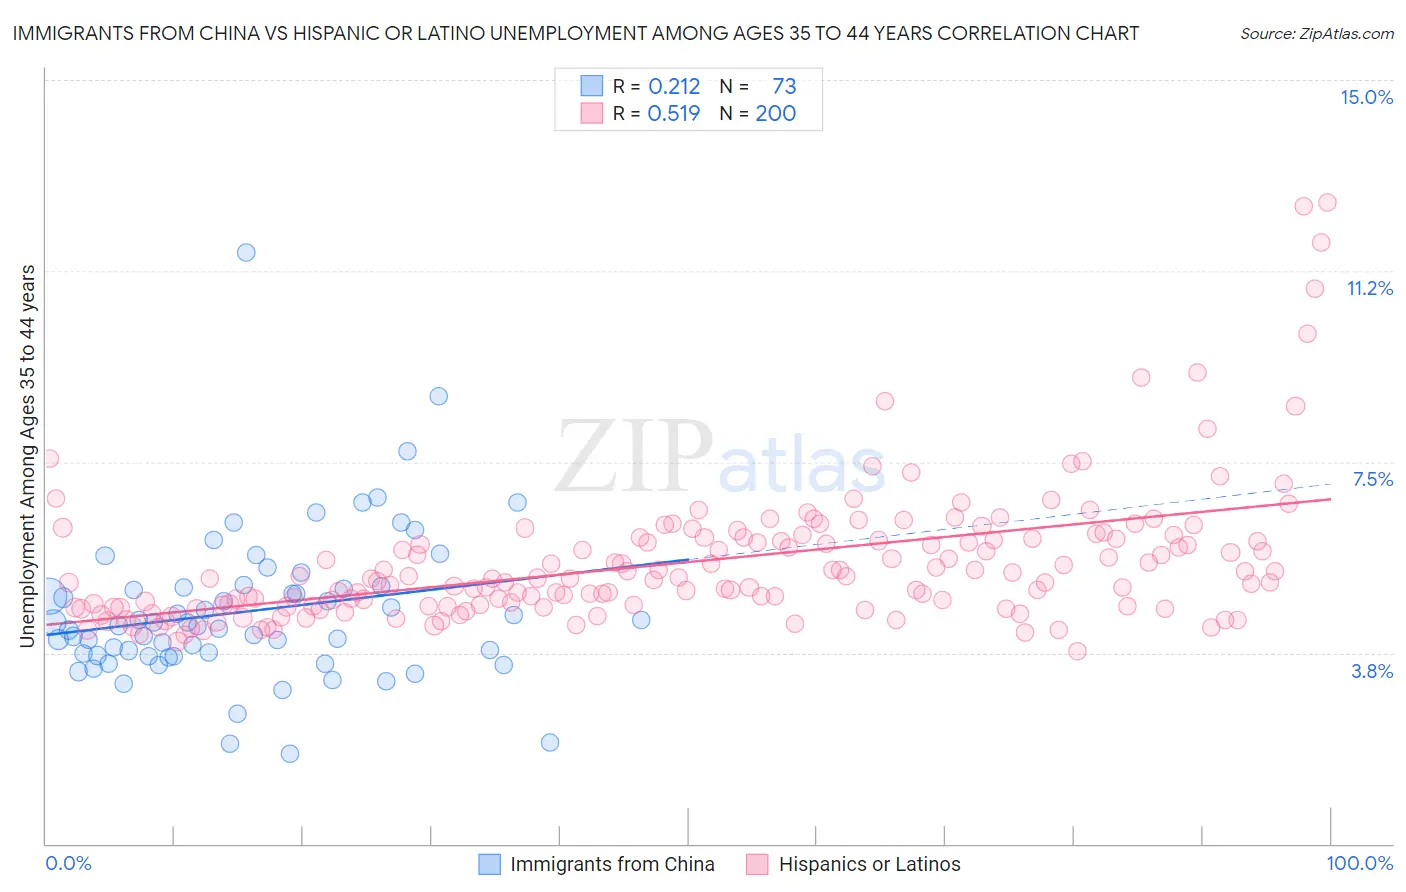
Immigrants from China vs Hispanic or Latino Unemployment Among Ages 35 to 44 years Correlation Chart
The statistical analysis conducted on geographies consisting of 443,365,937 people shows a weak positive correlation between the proportion of Immigrants from China and unemployment rate among population between the ages 35 and 44 in the United States with a correlation coefficient (R) of 0.212 and weighted average of 4.4%. Similarly, the statistical analysis conducted on geographies consisting of 537,806,925 people shows a substantial positive correlation between the proportion of Hispanics or Latinos and unemployment rate among population between the ages 35 and 44 in the United States with a correlation coefficient (R) of 0.519 and weighted average of 5.5%, a difference of 24.5%.
Unemployment Among Ages 35 to 44 years Correlation Summary
| Measurement | Immigrants from China | Hispanic or Latino |
| Minimum | 1.8% | 3.8% |
| Maximum | 11.6% | 12.6% |
| Range | 9.8% | 8.8% |
| Mean | 4.6% | 5.5% |
| Median | 4.3% | 5.2% |
| Interquartile 25% (IQ1) | 3.7% | 4.7% |
| Interquartile 75% (IQ3) | 5.1% | 6.0% |
| Interquartile Range (IQR) | 1.4% | 1.3% |
| Standard Deviation (Sample) | 1.5% | 1.4% |
| Standard Deviation (Population) | 1.5% | 1.4% |
Similar Demographics by Unemployment Among Ages 35 to 44 years
Demographics Similar to Immigrants from China by Unemployment Among Ages 35 to 44 years
In terms of unemployment among ages 35 to 44 years, the demographic groups most similar to Immigrants from China are Slovene (4.4%, a difference of 0.0%), Immigrants from Lithuania (4.4%, a difference of 0.0%), Immigrants from Ireland (4.4%, a difference of 0.060%), Argentinean (4.4%, a difference of 0.070%), and Icelander (4.4%, a difference of 0.080%).
| Demographics | Rating | Rank | Unemployment Among Ages 35 to 44 years |
| Austrians | 97.1 /100 | #63 | Exceptional 4.4% |
| Immigrants | Serbia | 97.0 /100 | #64 | Exceptional 4.4% |
| Cambodians | 97.0 /100 | #65 | Exceptional 4.4% |
| Icelanders | 96.8 /100 | #66 | Exceptional 4.4% |
| Argentineans | 96.8 /100 | #67 | Exceptional 4.4% |
| Immigrants | Ireland | 96.8 /100 | #68 | Exceptional 4.4% |
| Slovenes | 96.7 /100 | #69 | Exceptional 4.4% |
| Immigrants | China | 96.7 /100 | #70 | Exceptional 4.4% |
| Immigrants | Lithuania | 96.7 /100 | #71 | Exceptional 4.4% |
| Northern Europeans | 96.5 /100 | #72 | Exceptional 4.4% |
| Lithuanians | 96.5 /100 | #73 | Exceptional 4.4% |
| Poles | 96.4 /100 | #74 | Exceptional 4.4% |
| Immigrants | Romania | 96.3 /100 | #75 | Exceptional 4.4% |
| Immigrants | Jordan | 96.3 /100 | #76 | Exceptional 4.4% |
| Dutch | 96.1 /100 | #77 | Exceptional 4.4% |
Demographics Similar to Hispanics or Latinos by Unemployment Among Ages 35 to 44 years
In terms of unemployment among ages 35 to 44 years, the demographic groups most similar to Hispanics or Latinos are Immigrants from Micronesia (5.5%, a difference of 0.12%), Haitian (5.5%, a difference of 0.16%), French American Indian (5.5%, a difference of 0.24%), Cree (5.5%, a difference of 0.40%), and Immigrants from Ecuador (5.4%, a difference of 0.70%).
| Demographics | Rating | Rank | Unemployment Among Ages 35 to 44 years |
| Lumbee | 0.0 /100 | #278 | Tragic 5.4% |
| Immigrants | Senegal | 0.0 /100 | #279 | Tragic 5.4% |
| Ecuadorians | 0.0 /100 | #280 | Tragic 5.4% |
| Immigrants | Portugal | 0.0 /100 | #281 | Tragic 5.4% |
| Immigrants | Ghana | 0.0 /100 | #282 | Tragic 5.4% |
| Immigrants | Ecuador | 0.0 /100 | #283 | Tragic 5.4% |
| Haitians | 0.0 /100 | #284 | Tragic 5.5% |
| Hispanics or Latinos | 0.0 /100 | #285 | Tragic 5.5% |
| Immigrants | Micronesia | 0.0 /100 | #286 | Tragic 5.5% |
| French American Indians | 0.0 /100 | #287 | Tragic 5.5% |
| Cree | 0.0 /100 | #288 | Tragic 5.5% |
| Spanish American Indians | 0.0 /100 | #289 | Tragic 5.5% |
| Jamaicans | 0.0 /100 | #290 | Tragic 5.5% |
| Dutch West Indians | 0.0 /100 | #291 | Tragic 5.5% |
| Immigrants | Haiti | 0.0 /100 | #292 | Tragic 5.5% |