Cambodian vs Hispanic or Latino Poverty
COMPARE
Cambodian
Hispanic or Latino
Poverty
Poverty Comparison
Cambodians
Hispanics or Latinos
11.3%
POVERTY
96.7/ 100
METRIC RATING
79th/ 347
METRIC RANK
15.3%
POVERTY
0.0/ 100
METRIC RATING
296th/ 347
METRIC RANK
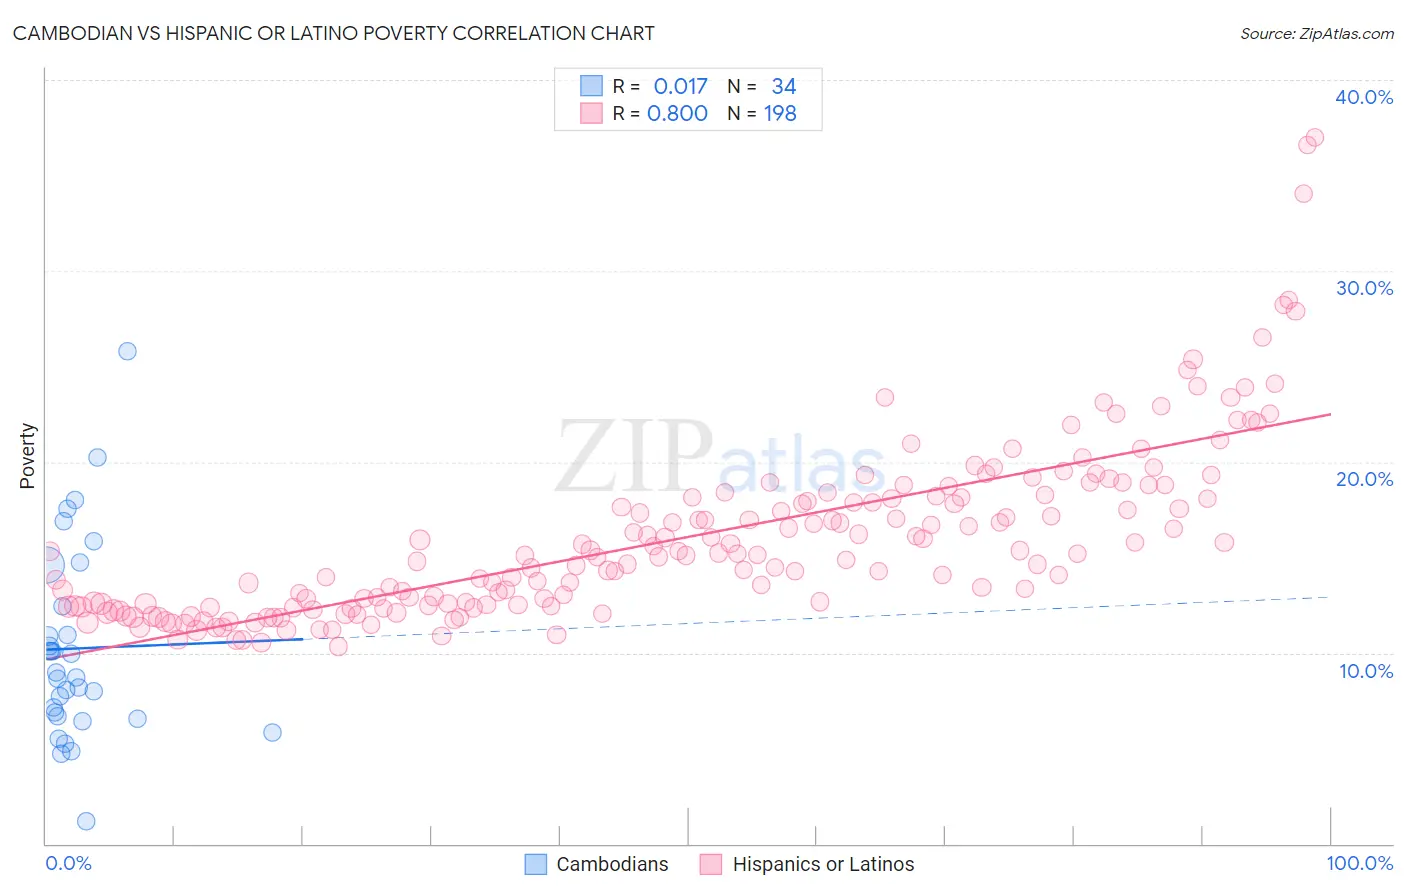
Cambodian vs Hispanic or Latino Poverty Correlation Chart
The statistical analysis conducted on geographies consisting of 102,491,880 people shows no correlation between the proportion of Cambodians and poverty level in the United States with a correlation coefficient (R) of 0.017 and weighted average of 11.3%. Similarly, the statistical analysis conducted on geographies consisting of 574,490,073 people shows a very strong positive correlation between the proportion of Hispanics or Latinos and poverty level in the United States with a correlation coefficient (R) of 0.800 and weighted average of 15.3%, a difference of 34.9%.
Poverty Correlation Summary
| Measurement | Cambodian | Hispanic or Latino |
| Minimum | 1.2% | 10.3% |
| Maximum | 25.8% | 37.0% |
| Range | 24.6% | 26.7% |
| Mean | 10.2% | 16.0% |
| Median | 8.8% | 15.1% |
| Interquartile 25% (IQ1) | 6.7% | 12.5% |
| Interquartile 75% (IQ3) | 12.4% | 18.1% |
| Interquartile Range (IQR) | 5.7% | 5.6% |
| Standard Deviation (Sample) | 5.1% | 4.6% |
| Standard Deviation (Population) | 5.1% | 4.6% |
Similar Demographics by Poverty
Demographics Similar to Cambodians by Poverty
In terms of poverty, the demographic groups most similar to Cambodians are Indian (Asian) (11.3%, a difference of 0.020%), Irish (11.3%, a difference of 0.020%), Dutch (11.3%, a difference of 0.040%), Immigrants from Eastern Asia (11.3%, a difference of 0.060%), and Egyptian (11.3%, a difference of 0.12%).
| Demographics | Rating | Rank | Poverty |
| Europeans | 97.2 /100 | #72 | Exceptional 11.3% |
| Immigrants | Belgium | 97.2 /100 | #73 | Exceptional 11.3% |
| Carpatho Rusyns | 97.2 /100 | #74 | Exceptional 11.3% |
| Immigrants | Eastern Europe | 97.0 /100 | #75 | Exceptional 11.3% |
| Immigrants | North America | 96.8 /100 | #76 | Exceptional 11.3% |
| Immigrants | Eastern Asia | 96.7 /100 | #77 | Exceptional 11.3% |
| Dutch | 96.7 /100 | #78 | Exceptional 11.3% |
| Cambodians | 96.7 /100 | #79 | Exceptional 11.3% |
| Indians (Asian) | 96.6 /100 | #80 | Exceptional 11.3% |
| Irish | 96.6 /100 | #81 | Exceptional 11.3% |
| Egyptians | 96.5 /100 | #82 | Exceptional 11.3% |
| Immigrants | Sweden | 96.3 /100 | #83 | Exceptional 11.3% |
| English | 96.3 /100 | #84 | Exceptional 11.3% |
| Immigrants | England | 96.2 /100 | #85 | Exceptional 11.4% |
| Jordanians | 96.0 /100 | #86 | Exceptional 11.4% |
Demographics Similar to Hispanics or Latinos by Poverty
In terms of poverty, the demographic groups most similar to Hispanics or Latinos are Guatemalan (15.3%, a difference of 0.010%), Immigrants from Bangladesh (15.3%, a difference of 0.050%), Immigrants from Senegal (15.3%, a difference of 0.19%), Senegalese (15.3%, a difference of 0.29%), and Blackfeet (15.2%, a difference of 0.43%).
| Demographics | Rating | Rank | Poverty |
| Immigrants | Belize | 0.0 /100 | #289 | Tragic 15.1% |
| Mexicans | 0.0 /100 | #290 | Tragic 15.1% |
| Immigrants | Cabo Verde | 0.0 /100 | #291 | Tragic 15.1% |
| Indonesians | 0.0 /100 | #292 | Tragic 15.1% |
| Immigrants | Zaire | 0.0 /100 | #293 | Tragic 15.1% |
| Blackfeet | 0.0 /100 | #294 | Tragic 15.2% |
| Guatemalans | 0.0 /100 | #295 | Tragic 15.3% |
| Hispanics or Latinos | 0.0 /100 | #296 | Tragic 15.3% |
| Immigrants | Bangladesh | 0.0 /100 | #297 | Tragic 15.3% |
| Immigrants | Senegal | 0.0 /100 | #298 | Tragic 15.3% |
| Senegalese | 0.0 /100 | #299 | Tragic 15.3% |
| Immigrants | Central America | 0.0 /100 | #300 | Tragic 15.4% |
| Bahamians | 0.0 /100 | #301 | Tragic 15.4% |
| Somalis | 0.0 /100 | #302 | Tragic 15.4% |
| Immigrants | Caribbean | 0.0 /100 | #303 | Tragic 15.5% |