Nigerian vs Immigrants from Latin America Poverty
COMPARE
Nigerian
Immigrants from Latin America
Poverty
Poverty Comparison
Nigerians
Immigrants from Latin America
13.6%
POVERTY
1.4/ 100
METRIC RATING
231st/ 347
METRIC RANK
15.0%
POVERTY
0.0/ 100
METRIC RATING
286th/ 347
METRIC RANK
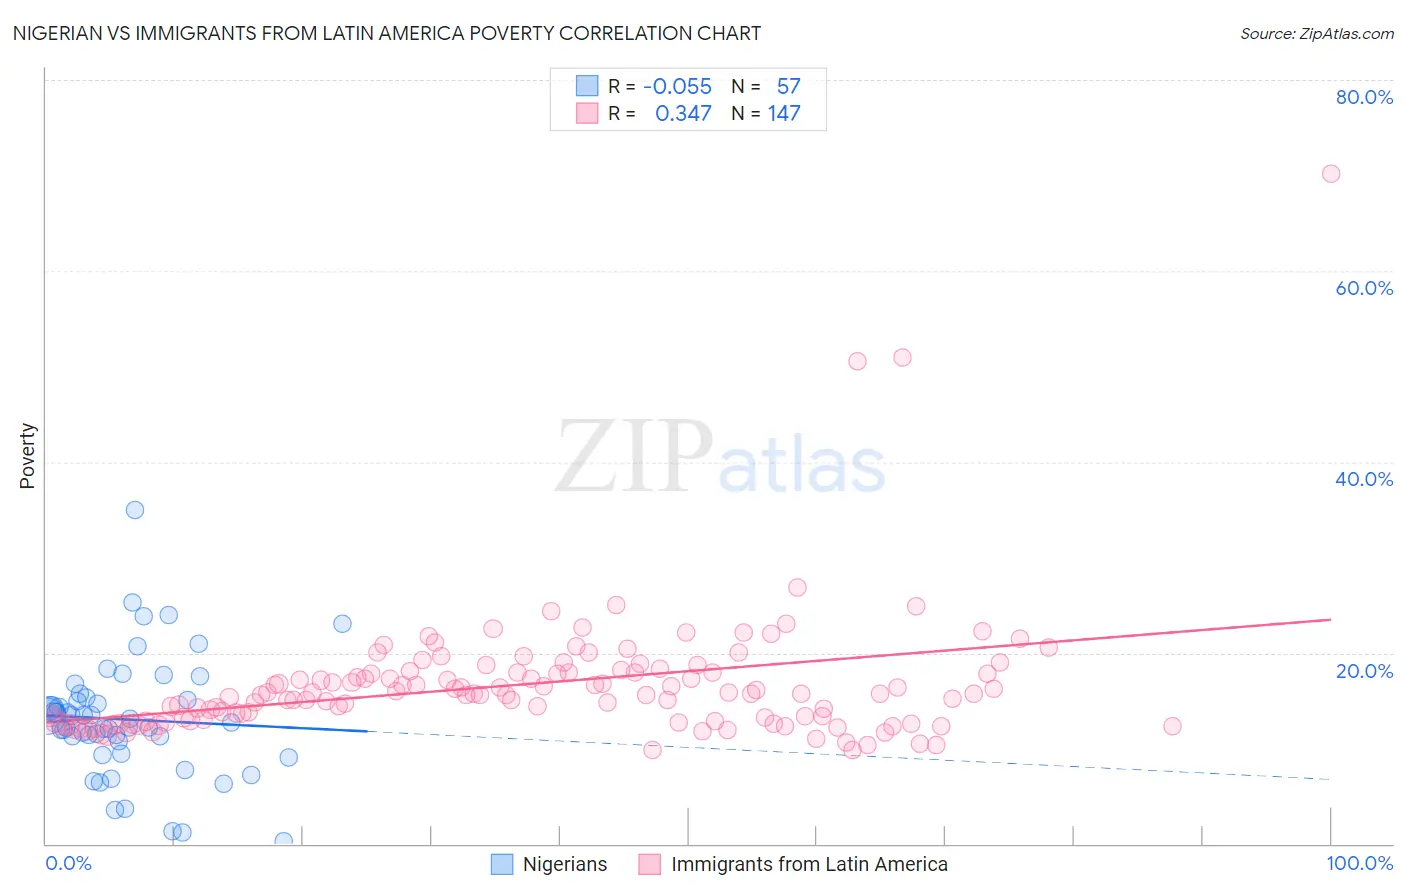
Nigerian vs Immigrants from Latin America Poverty Correlation Chart
The statistical analysis conducted on geographies consisting of 332,501,950 people shows a slight negative correlation between the proportion of Nigerians and poverty level in the United States with a correlation coefficient (R) of -0.055 and weighted average of 13.6%. Similarly, the statistical analysis conducted on geographies consisting of 557,920,338 people shows a mild positive correlation between the proportion of Immigrants from Latin America and poverty level in the United States with a correlation coefficient (R) of 0.347 and weighted average of 15.0%, a difference of 10.6%.
Poverty Correlation Summary
| Measurement | Nigerian | Immigrants from Latin America |
| Minimum | 0.27% | 9.8% |
| Maximum | 35.0% | 70.2% |
| Range | 34.7% | 60.4% |
| Mean | 13.0% | 16.7% |
| Median | 12.6% | 15.7% |
| Interquartile 25% (IQ1) | 10.1% | 12.9% |
| Interquartile 75% (IQ3) | 15.2% | 17.9% |
| Interquartile Range (IQR) | 5.1% | 5.0% |
| Standard Deviation (Sample) | 6.2% | 6.9% |
| Standard Deviation (Population) | 6.1% | 6.9% |
Similar Demographics by Poverty
Demographics Similar to Nigerians by Poverty
In terms of poverty, the demographic groups most similar to Nigerians are Alaskan Athabascan (13.6%, a difference of 0.17%), Osage (13.6%, a difference of 0.22%), Immigrants from Nigeria (13.5%, a difference of 0.46%), Alaska Native (13.5%, a difference of 0.92%), and Marshallese (13.4%, a difference of 1.1%).
| Demographics | Rating | Rank | Poverty |
| Immigrants | Eritrea | 2.4 /100 | #224 | Tragic 13.4% |
| German Russians | 2.2 /100 | #225 | Tragic 13.4% |
| Marshallese | 2.2 /100 | #226 | Tragic 13.4% |
| Alaska Natives | 2.1 /100 | #227 | Tragic 13.5% |
| Immigrants | Nigeria | 1.7 /100 | #228 | Tragic 13.5% |
| Osage | 1.5 /100 | #229 | Tragic 13.6% |
| Alaskan Athabascans | 1.5 /100 | #230 | Tragic 13.6% |
| Nigerians | 1.4 /100 | #231 | Tragic 13.6% |
| Fijians | 0.8 /100 | #232 | Tragic 13.7% |
| Immigrants | Saudi Arabia | 0.8 /100 | #233 | Tragic 13.8% |
| Immigrants | Laos | 0.7 /100 | #234 | Tragic 13.8% |
| Cubans | 0.6 /100 | #235 | Tragic 13.9% |
| Immigrants | Armenia | 0.5 /100 | #236 | Tragic 13.9% |
| French American Indians | 0.5 /100 | #237 | Tragic 13.9% |
| Ghanaians | 0.5 /100 | #238 | Tragic 13.9% |
Demographics Similar to Immigrants from Latin America by Poverty
In terms of poverty, the demographic groups most similar to Immigrants from Latin America are Inupiat (15.1%, a difference of 0.21%), Yaqui (15.1%, a difference of 0.22%), Vietnamese (15.0%, a difference of 0.26%), West Indian (15.0%, a difference of 0.32%), and Immigrants from Belize (15.1%, a difference of 0.34%).
| Demographics | Rating | Rank | Poverty |
| Immigrants | St. Vincent and the Grenadines | 0.0 /100 | #279 | Tragic 14.9% |
| Haitians | 0.0 /100 | #280 | Tragic 14.9% |
| Immigrants | Barbados | 0.0 /100 | #281 | Tragic 14.9% |
| Comanche | 0.0 /100 | #282 | Tragic 15.0% |
| Immigrants | Haiti | 0.0 /100 | #283 | Tragic 15.0% |
| West Indians | 0.0 /100 | #284 | Tragic 15.0% |
| Vietnamese | 0.0 /100 | #285 | Tragic 15.0% |
| Immigrants | Latin America | 0.0 /100 | #286 | Tragic 15.0% |
| Inupiat | 0.0 /100 | #287 | Tragic 15.1% |
| Yaqui | 0.0 /100 | #288 | Tragic 15.1% |
| Immigrants | Belize | 0.0 /100 | #289 | Tragic 15.1% |
| Mexicans | 0.0 /100 | #290 | Tragic 15.1% |
| Immigrants | Cabo Verde | 0.0 /100 | #291 | Tragic 15.1% |
| Indonesians | 0.0 /100 | #292 | Tragic 15.1% |
| Immigrants | Zaire | 0.0 /100 | #293 | Tragic 15.1% |