Immigrants from Caribbean vs Central American Single Female Poverty
COMPARE
Immigrants from Caribbean
Central American
Single Female Poverty
Single Female Poverty Comparison
Immigrants from Caribbean
Central Americans
22.4%
SINGLE FEMALE POVERTY
1.3/ 100
METRIC RATING
249th/ 347
METRIC RANK
23.0%
SINGLE FEMALE POVERTY
0.2/ 100
METRIC RATING
265th/ 347
METRIC RANK
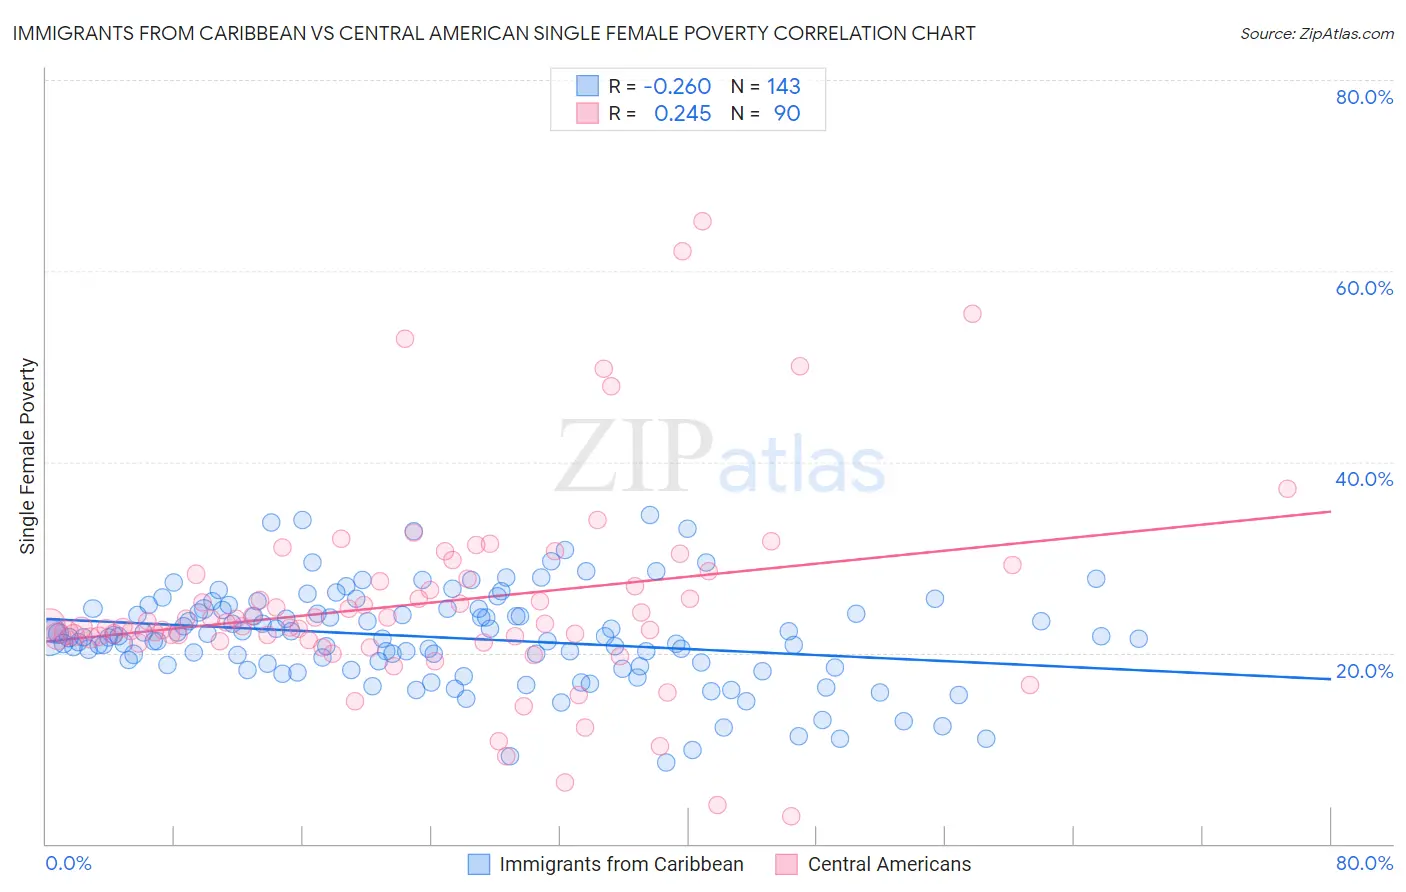
Immigrants from Caribbean vs Central American Single Female Poverty Correlation Chart
The statistical analysis conducted on geographies consisting of 441,756,238 people shows a weak negative correlation between the proportion of Immigrants from Caribbean and poverty level among single females in the United States with a correlation coefficient (R) of -0.260 and weighted average of 22.4%. Similarly, the statistical analysis conducted on geographies consisting of 494,457,156 people shows a weak positive correlation between the proportion of Central Americans and poverty level among single females in the United States with a correlation coefficient (R) of 0.245 and weighted average of 23.0%, a difference of 2.5%.
Single Female Poverty Correlation Summary
| Measurement | Immigrants from Caribbean | Central American |
| Minimum | 8.5% | 2.9% |
| Maximum | 34.5% | 65.2% |
| Range | 25.9% | 62.4% |
| Mean | 21.6% | 25.2% |
| Median | 21.7% | 23.0% |
| Interquartile 25% (IQ1) | 18.7% | 21.4% |
| Interquartile 75% (IQ3) | 24.6% | 27.8% |
| Interquartile Range (IQR) | 5.9% | 6.5% |
| Standard Deviation (Sample) | 5.0% | 10.7% |
| Standard Deviation (Population) | 5.0% | 10.6% |
Demographics Similar to Immigrants from Caribbean and Central Americans by Single Female Poverty
In terms of single female poverty, the demographic groups most similar to Immigrants from Caribbean are Belizean (22.4%, a difference of 0.10%), Immigrants from El Salvador (22.4%, a difference of 0.11%), Immigrants from Bahamas (22.5%, a difference of 0.15%), Immigrants from West Indies (22.5%, a difference of 0.29%), and Delaware (22.5%, a difference of 0.41%). Similarly, the demographic groups most similar to Central Americans are Immigrants from Laos (22.9%, a difference of 0.17%), Immigrants from Micronesia (23.0%, a difference of 0.21%), Scotch-Irish (22.9%, a difference of 0.24%), Senegalese (23.0%, a difference of 0.27%), and British West Indian (22.8%, a difference of 0.65%).
| Demographics | Rating | Rank | Single Female Poverty |
| Immigrants | El Salvador | 1.4 /100 | #247 | Tragic 22.4% |
| Belizeans | 1.4 /100 | #248 | Tragic 22.4% |
| Immigrants | Caribbean | 1.3 /100 | #249 | Tragic 22.4% |
| Immigrants | Bahamas | 1.2 /100 | #250 | Tragic 22.5% |
| Immigrants | West Indies | 1.0 /100 | #251 | Tragic 22.5% |
| Delaware | 1.0 /100 | #252 | Tragic 22.5% |
| Immigrants | Liberia | 0.9 /100 | #253 | Tragic 22.5% |
| Immigrants | Burma/Myanmar | 0.8 /100 | #254 | Tragic 22.6% |
| Immigrants | Sudan | 0.8 /100 | #255 | Tragic 22.6% |
| Immigrants | Belize | 0.8 /100 | #256 | Tragic 22.6% |
| Sudanese | 0.7 /100 | #257 | Tragic 22.6% |
| Bahamians | 0.6 /100 | #258 | Tragic 22.7% |
| Whites/Caucasians | 0.6 /100 | #259 | Tragic 22.7% |
| Celtics | 0.5 /100 | #260 | Tragic 22.7% |
| Immigrants | Cabo Verde | 0.4 /100 | #261 | Tragic 22.8% |
| British West Indians | 0.4 /100 | #262 | Tragic 22.8% |
| Scotch-Irish | 0.3 /100 | #263 | Tragic 22.9% |
| Immigrants | Laos | 0.3 /100 | #264 | Tragic 22.9% |
| Central Americans | 0.2 /100 | #265 | Tragic 23.0% |
| Immigrants | Micronesia | 0.2 /100 | #266 | Tragic 23.0% |
| Senegalese | 0.2 /100 | #267 | Tragic 23.0% |