Immigrants from Caribbean vs Cambodian Median Earnings
COMPARE
Immigrants from Caribbean
Cambodian
Median Earnings
Median Earnings Comparison
Immigrants from Caribbean
Cambodians
$41,119
MEDIAN EARNINGS
0.1/ 100
METRIC RATING
299th/ 347
METRIC RANK
$53,386
MEDIAN EARNINGS
100.0/ 100
METRIC RATING
30th/ 347
METRIC RANK
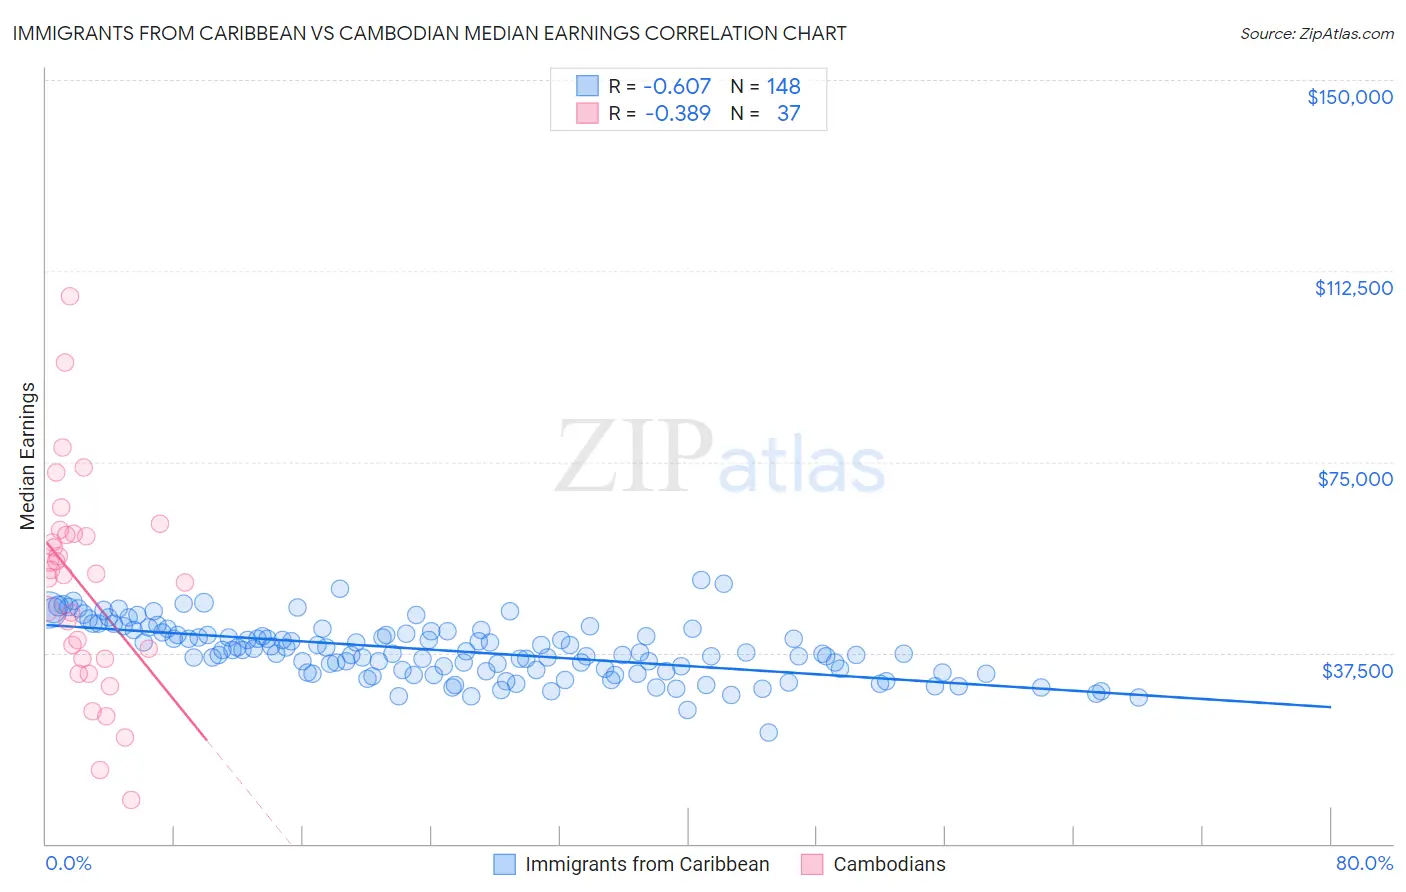
Immigrants from Caribbean vs Cambodian Median Earnings Correlation Chart
The statistical analysis conducted on geographies consisting of 450,013,484 people shows a significant negative correlation between the proportion of Immigrants from Caribbean and median earnings in the United States with a correlation coefficient (R) of -0.607 and weighted average of $41,119. Similarly, the statistical analysis conducted on geographies consisting of 102,521,064 people shows a mild negative correlation between the proportion of Cambodians and median earnings in the United States with a correlation coefficient (R) of -0.389 and weighted average of $53,386, a difference of 29.8%.
Median Earnings Correlation Summary
| Measurement | Immigrants from Caribbean | Cambodian |
| Minimum | $21,741 | $8,623 |
| Maximum | $51,911 | $107,569 |
| Range | $30,170 | $98,946 |
| Mean | $37,958 | $50,400 |
| Median | $37,629 | $52,839 |
| Interquartile 25% (IQ1) | $33,921 | $36,414 |
| Interquartile 75% (IQ3) | $41,541 | $60,699 |
| Interquartile Range (IQR) | $7,620 | $24,284 |
| Standard Deviation (Sample) | $5,439 | $20,473 |
| Standard Deviation (Population) | $5,421 | $20,194 |
Similar Demographics by Median Earnings
Demographics Similar to Immigrants from Caribbean by Median Earnings
In terms of median earnings, the demographic groups most similar to Immigrants from Caribbean are Immigrants from Micronesia ($41,133, a difference of 0.030%), Ute ($41,051, a difference of 0.17%), Immigrants from Latin America ($41,049, a difference of 0.17%), Guatemalan ($41,205, a difference of 0.21%), and Cherokee ($41,252, a difference of 0.32%).
| Demographics | Rating | Rank | Median Earnings |
| U.S. Virgin Islanders | 0.1 /100 | #292 | Tragic $41,448 |
| Immigrants | Zaire | 0.1 /100 | #293 | Tragic $41,325 |
| Potawatomi | 0.1 /100 | #294 | Tragic $41,288 |
| Bangladeshis | 0.1 /100 | #295 | Tragic $41,263 |
| Cherokee | 0.1 /100 | #296 | Tragic $41,252 |
| Guatemalans | 0.1 /100 | #297 | Tragic $41,205 |
| Immigrants | Micronesia | 0.1 /100 | #298 | Tragic $41,133 |
| Immigrants | Caribbean | 0.1 /100 | #299 | Tragic $41,119 |
| Ute | 0.1 /100 | #300 | Tragic $41,051 |
| Immigrants | Latin America | 0.1 /100 | #301 | Tragic $41,049 |
| Shoshone | 0.0 /100 | #302 | Tragic $40,932 |
| Haitians | 0.0 /100 | #303 | Tragic $40,918 |
| Immigrants | Guatemala | 0.0 /100 | #304 | Tragic $40,851 |
| Chickasaw | 0.0 /100 | #305 | Tragic $40,672 |
| Yaqui | 0.0 /100 | #306 | Tragic $40,647 |
Demographics Similar to Cambodians by Median Earnings
In terms of median earnings, the demographic groups most similar to Cambodians are Russian ($53,334, a difference of 0.10%), Immigrants from Russia ($53,457, a difference of 0.13%), Immigrants from Asia ($53,310, a difference of 0.14%), Immigrants from Greece ($53,282, a difference of 0.19%), and Immigrants from France ($53,490, a difference of 0.20%).
| Demographics | Rating | Rank | Median Earnings |
| Immigrants | Sweden | 100.0 /100 | #23 | Exceptional $54,478 |
| Soviet Union | 100.0 /100 | #24 | Exceptional $54,290 |
| Turks | 100.0 /100 | #25 | Exceptional $53,919 |
| Immigrants | Northern Europe | 100.0 /100 | #26 | Exceptional $53,872 |
| Asians | 100.0 /100 | #27 | Exceptional $53,690 |
| Immigrants | France | 100.0 /100 | #28 | Exceptional $53,490 |
| Immigrants | Russia | 100.0 /100 | #29 | Exceptional $53,457 |
| Cambodians | 100.0 /100 | #30 | Exceptional $53,386 |
| Russians | 100.0 /100 | #31 | Exceptional $53,334 |
| Immigrants | Asia | 100.0 /100 | #32 | Exceptional $53,310 |
| Immigrants | Greece | 100.0 /100 | #33 | Exceptional $53,282 |
| Immigrants | Sri Lanka | 100.0 /100 | #34 | Exceptional $53,268 |
| Immigrants | Switzerland | 100.0 /100 | #35 | Exceptional $53,211 |
| Immigrants | Denmark | 100.0 /100 | #36 | Exceptional $53,186 |
| Immigrants | Belarus | 100.0 /100 | #37 | Exceptional $53,043 |