Immigrants from Caribbean vs Immigrants from Western Africa Single Female Poverty
COMPARE
Immigrants from Caribbean
Immigrants from Western Africa
Single Female Poverty
Single Female Poverty Comparison
Immigrants from Caribbean
Immigrants from Western Africa
22.4%
SINGLE FEMALE POVERTY
1.3/ 100
METRIC RATING
249th/ 347
METRIC RANK
22.0%
SINGLE FEMALE POVERTY
5.3/ 100
METRIC RATING
230th/ 347
METRIC RANK
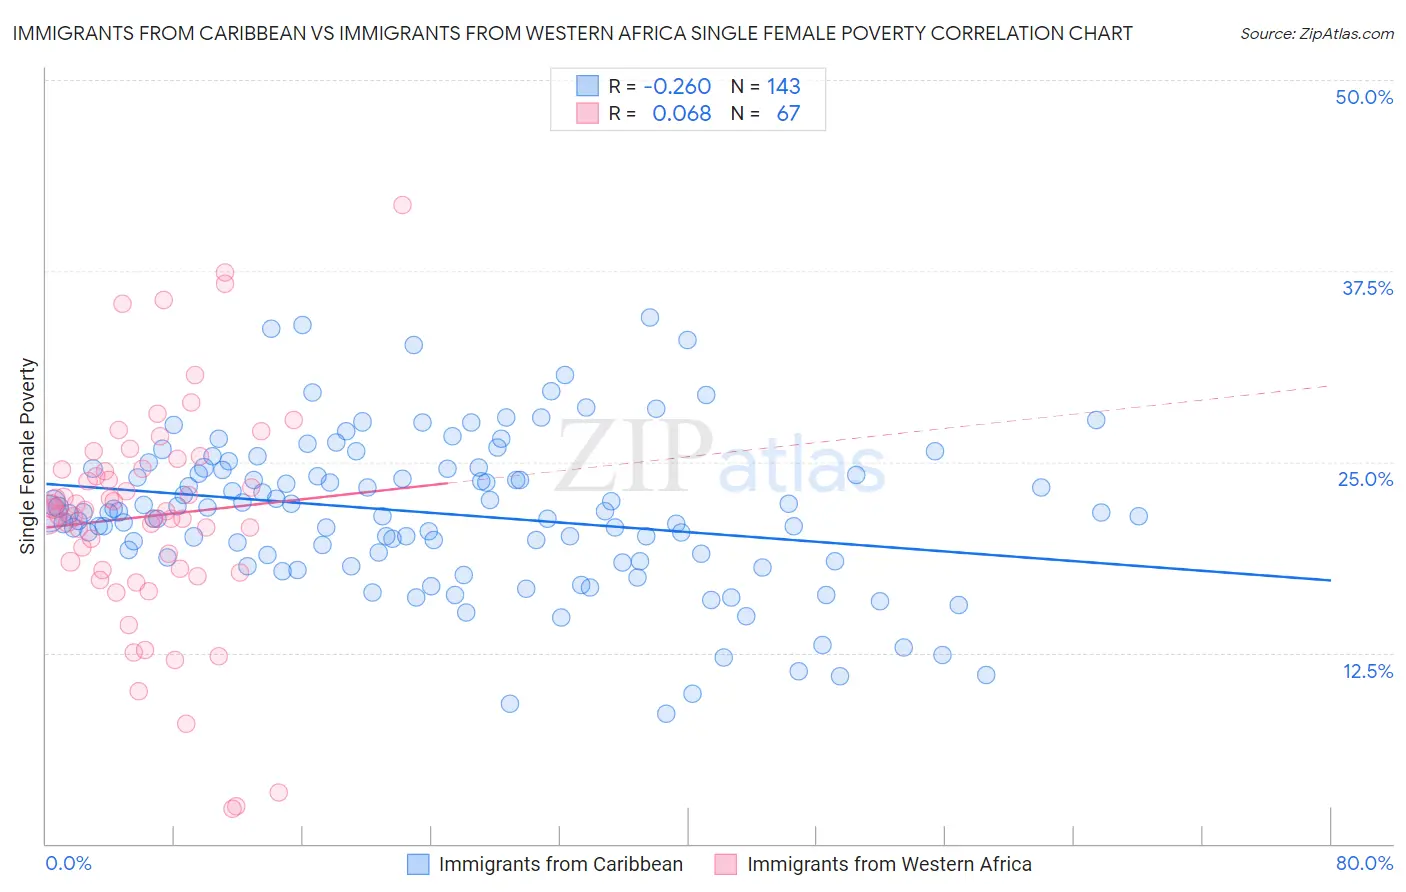
Immigrants from Caribbean vs Immigrants from Western Africa Single Female Poverty Correlation Chart
The statistical analysis conducted on geographies consisting of 441,756,238 people shows a weak negative correlation between the proportion of Immigrants from Caribbean and poverty level among single females in the United States with a correlation coefficient (R) of -0.260 and weighted average of 22.4%. Similarly, the statistical analysis conducted on geographies consisting of 354,181,306 people shows a slight positive correlation between the proportion of Immigrants from Western Africa and poverty level among single females in the United States with a correlation coefficient (R) of 0.068 and weighted average of 22.0%, a difference of 2.2%.
Single Female Poverty Correlation Summary
| Measurement | Immigrants from Caribbean | Immigrants from Western Africa |
| Minimum | 8.5% | 2.3% |
| Maximum | 34.5% | 41.8% |
| Range | 25.9% | 39.5% |
| Mean | 21.6% | 21.4% |
| Median | 21.7% | 21.8% |
| Interquartile 25% (IQ1) | 18.7% | 18.0% |
| Interquartile 75% (IQ3) | 24.6% | 24.5% |
| Interquartile Range (IQR) | 5.9% | 6.6% |
| Standard Deviation (Sample) | 5.0% | 7.4% |
| Standard Deviation (Population) | 5.0% | 7.4% |
Demographics Similar to Immigrants from Caribbean and Immigrants from Western Africa by Single Female Poverty
In terms of single female poverty, the demographic groups most similar to Immigrants from Caribbean are Belizean (22.4%, a difference of 0.10%), Immigrants from El Salvador (22.4%, a difference of 0.11%), Liberian (22.4%, a difference of 0.17%), Immigrants from Bangladesh (22.3%, a difference of 0.54%), and Immigrants from Middle Africa (22.3%, a difference of 0.58%). Similarly, the demographic groups most similar to Immigrants from Western Africa are Tlingit-Haida (21.9%, a difference of 0.020%), Welsh (22.0%, a difference of 0.090%), Immigrants from Thailand (22.0%, a difference of 0.10%), Spaniard (22.0%, a difference of 0.20%), and Spanish (22.0%, a difference of 0.20%).
| Demographics | Rating | Rank | Single Female Poverty |
| Tlingit-Haida | 5.4 /100 | #229 | Tragic 21.9% |
| Immigrants | Western Africa | 5.3 /100 | #230 | Tragic 22.0% |
| Welsh | 5.0 /100 | #231 | Tragic 22.0% |
| Immigrants | Thailand | 5.0 /100 | #232 | Tragic 22.0% |
| Spaniards | 4.7 /100 | #233 | Tragic 22.0% |
| Spanish | 4.7 /100 | #234 | Tragic 22.0% |
| Dutch | 4.6 /100 | #235 | Tragic 22.0% |
| Immigrants | Ecuador | 4.2 /100 | #236 | Tragic 22.0% |
| Vietnamese | 4.0 /100 | #237 | Tragic 22.0% |
| French Canadians | 2.8 /100 | #238 | Tragic 22.2% |
| Malaysians | 2.8 /100 | #239 | Tragic 22.2% |
| French | 2.3 /100 | #240 | Tragic 22.2% |
| Cape Verdeans | 2.1 /100 | #241 | Tragic 22.3% |
| Bermudans | 2.0 /100 | #242 | Tragic 22.3% |
| West Indians | 1.9 /100 | #243 | Tragic 22.3% |
| Immigrants | Middle Africa | 1.9 /100 | #244 | Tragic 22.3% |
| Immigrants | Bangladesh | 1.8 /100 | #245 | Tragic 22.3% |
| Liberians | 1.4 /100 | #246 | Tragic 22.4% |
| Immigrants | El Salvador | 1.4 /100 | #247 | Tragic 22.4% |
| Belizeans | 1.4 /100 | #248 | Tragic 22.4% |
| Immigrants | Caribbean | 1.3 /100 | #249 | Tragic 22.4% |