Immigrants from Cabo Verde vs Nigerian Married-Couple Family Poverty
COMPARE
Immigrants from Cabo Verde
Nigerian
Married-Couple Family Poverty
Married-Couple Family Poverty Comparison
Immigrants from Cabo Verde
Nigerians
5.3%
MARRIED-COUPLE FAMILY POVERTY
30.9/ 100
METRIC RATING
191st/ 347
METRIC RANK
5.5%
MARRIED-COUPLE FAMILY POVERTY
14.3/ 100
METRIC RATING
211th/ 347
METRIC RANK
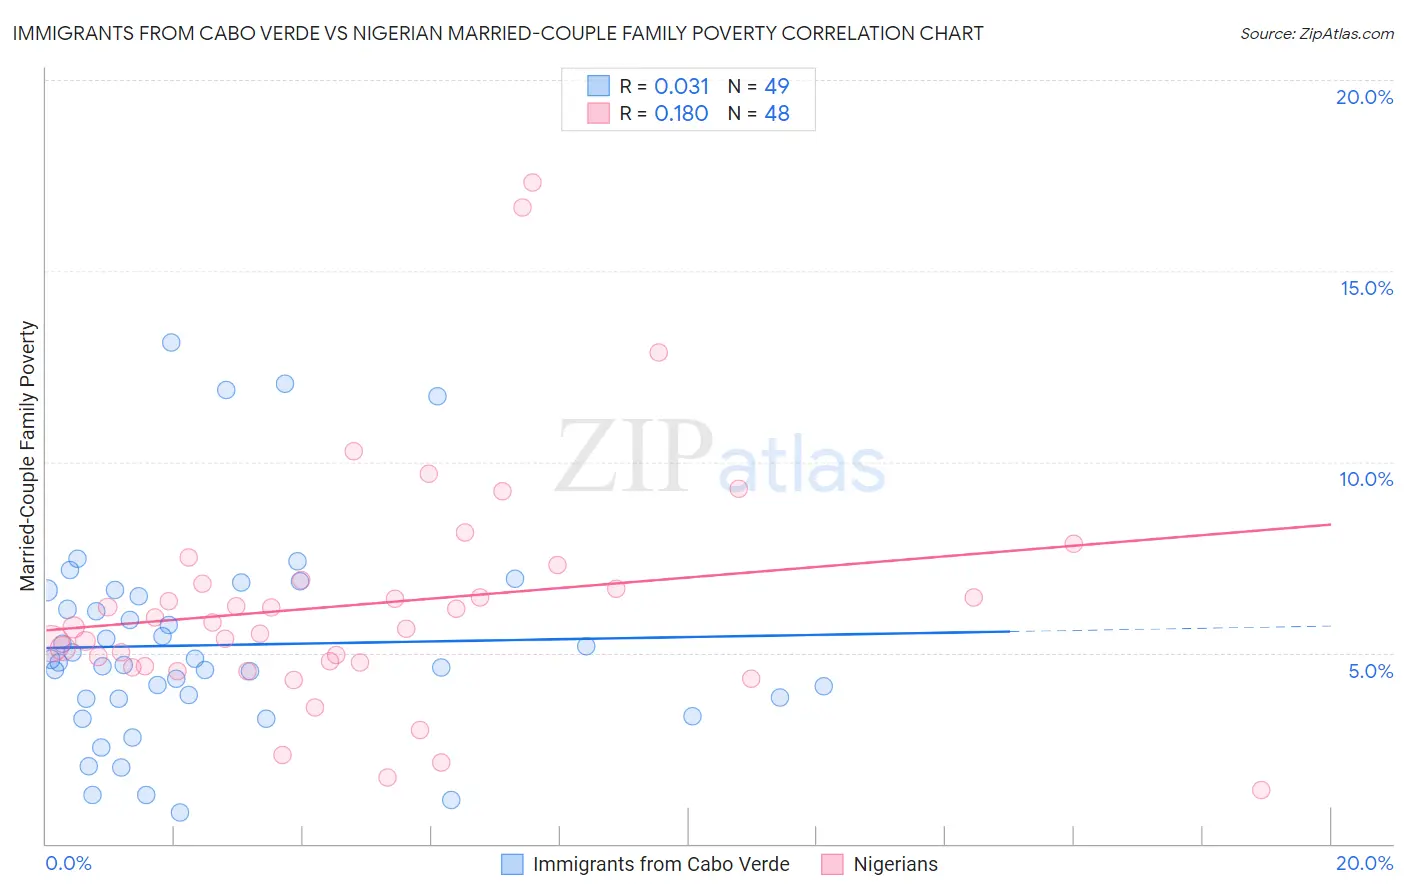
Immigrants from Cabo Verde vs Nigerian Married-Couple Family Poverty Correlation Chart
The statistical analysis conducted on geographies consisting of 38,016,283 people shows no correlation between the proportion of Immigrants from Cabo Verde and poverty level among married-couple families in the United States with a correlation coefficient (R) of 0.031 and weighted average of 5.3%. Similarly, the statistical analysis conducted on geographies consisting of 330,785,707 people shows a poor positive correlation between the proportion of Nigerians and poverty level among married-couple families in the United States with a correlation coefficient (R) of 0.180 and weighted average of 5.5%, a difference of 2.8%.
Married-Couple Family Poverty Correlation Summary
| Measurement | Immigrants from Cabo Verde | Nigerian |
| Minimum | 0.81% | 1.4% |
| Maximum | 13.1% | 17.3% |
| Range | 12.3% | 15.9% |
| Mean | 5.2% | 6.3% |
| Median | 4.7% | 5.7% |
| Interquartile 25% (IQ1) | 3.8% | 4.7% |
| Interquartile 75% (IQ3) | 6.6% | 6.9% |
| Interquartile Range (IQR) | 2.8% | 2.1% |
| Standard Deviation (Sample) | 2.7% | 3.1% |
| Standard Deviation (Population) | 2.7% | 3.1% |
Demographics Similar to Immigrants from Cabo Verde and Nigerians by Married-Couple Family Poverty
In terms of married-couple family poverty, the demographic groups most similar to Immigrants from Cabo Verde are Cape Verdean (5.3%, a difference of 0.030%), Malaysian (5.4%, a difference of 0.19%), Immigrants from Israel (5.4%, a difference of 0.42%), Immigrants from the Azores (5.4%, a difference of 0.46%), and Spaniard (5.4%, a difference of 0.48%). Similarly, the demographic groups most similar to Nigerians are Immigrants from Micronesia (5.5%, a difference of 0.020%), Immigrants from Syria (5.5%, a difference of 0.23%), French American Indian (5.5%, a difference of 0.37%), Immigrants from Africa (5.5%, a difference of 0.69%), and Osage (5.4%, a difference of 0.82%).
| Demographics | Rating | Rank | Married-Couple Family Poverty |
| Immigrants | Cabo Verde | 30.9 /100 | #191 | Fair 5.3% |
| Cape Verdeans | 30.7 /100 | #192 | Fair 5.3% |
| Malaysians | 29.5 /100 | #193 | Fair 5.4% |
| Immigrants | Israel | 27.8 /100 | #194 | Fair 5.4% |
| Immigrants | Azores | 27.5 /100 | #195 | Fair 5.4% |
| Spaniards | 27.4 /100 | #196 | Fair 5.4% |
| Liberians | 26.3 /100 | #197 | Fair 5.4% |
| Immigrants | Belarus | 26.2 /100 | #198 | Fair 5.4% |
| Uruguayans | 25.0 /100 | #199 | Fair 5.4% |
| Immigrants | Morocco | 24.3 /100 | #200 | Fair 5.4% |
| Lebanese | 24.1 /100 | #201 | Fair 5.4% |
| Immigrants | Middle Africa | 23.8 /100 | #202 | Fair 5.4% |
| Immigrants | Peru | 21.8 /100 | #203 | Fair 5.4% |
| Immigrants | Costa Rica | 19.4 /100 | #204 | Poor 5.4% |
| Chippewa | 18.9 /100 | #205 | Poor 5.4% |
| Osage | 18.4 /100 | #206 | Poor 5.4% |
| Immigrants | Africa | 17.6 /100 | #207 | Poor 5.5% |
| French American Indians | 16.1 /100 | #208 | Poor 5.5% |
| Immigrants | Syria | 15.4 /100 | #209 | Poor 5.5% |
| Immigrants | Micronesia | 14.4 /100 | #210 | Poor 5.5% |
| Nigerians | 14.3 /100 | #211 | Poor 5.5% |