Immigrants from Cabo Verde vs Polish Single Mother Households
COMPARE
Immigrants from Cabo Verde
Polish
Single Mother Households
Single Mother Households Comparison
Immigrants from Cabo Verde
Poles
9.6%
SINGLE MOTHER HOUSEHOLDS
0.0/ 100
METRIC RATING
345th/ 347
METRIC RANK
5.6%
SINGLE MOTHER HOUSEHOLDS
98.6/ 100
METRIC RATING
62nd/ 347
METRIC RANK
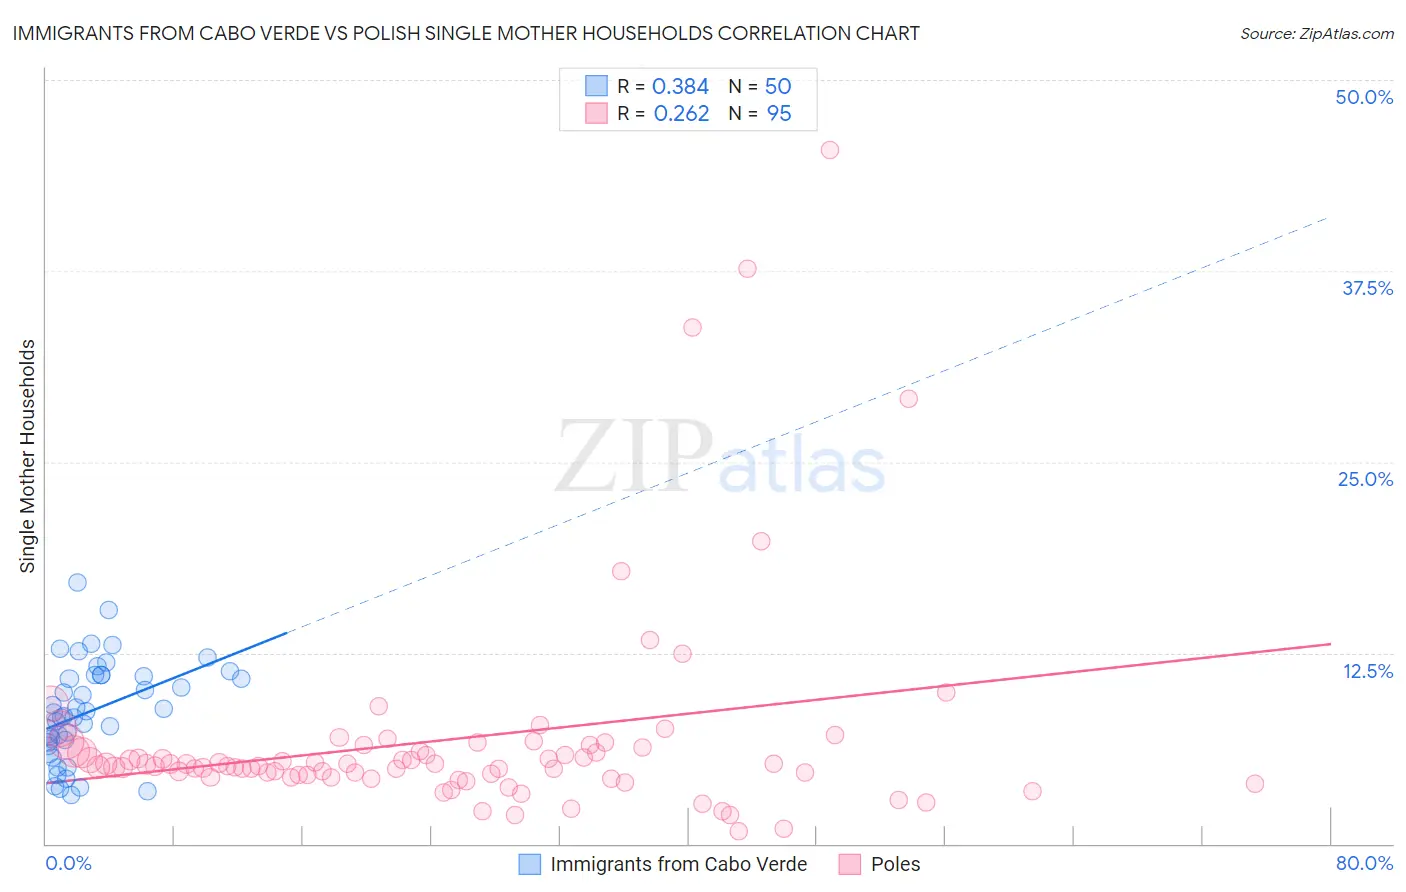
Immigrants from Cabo Verde vs Polish Single Mother Households Correlation Chart
The statistical analysis conducted on geographies consisting of 38,117,400 people shows a mild positive correlation between the proportion of Immigrants from Cabo Verde and percentage of single mother households in the United States with a correlation coefficient (R) of 0.384 and weighted average of 9.6%. Similarly, the statistical analysis conducted on geographies consisting of 555,545,245 people shows a weak positive correlation between the proportion of Poles and percentage of single mother households in the United States with a correlation coefficient (R) of 0.262 and weighted average of 5.6%, a difference of 71.9%.
Single Mother Households Correlation Summary
| Measurement | Immigrants from Cabo Verde | Polish |
| Minimum | 3.2% | 0.85% |
| Maximum | 17.1% | 45.5% |
| Range | 13.9% | 44.6% |
| Mean | 8.7% | 6.8% |
| Median | 8.5% | 5.2% |
| Interquartile 25% (IQ1) | 6.6% | 4.4% |
| Interquartile 75% (IQ3) | 11.0% | 6.3% |
| Interquartile Range (IQR) | 4.4% | 1.9% |
| Standard Deviation (Sample) | 3.2% | 7.0% |
| Standard Deviation (Population) | 3.2% | 6.9% |
Similar Demographics by Single Mother Households
Demographics Similar to Immigrants from Cabo Verde by Single Mother Households
In terms of single mother households, the demographic groups most similar to Immigrants from Cabo Verde are Yuman (9.6%, a difference of 0.59%), Immigrants from Dominican Republic (9.5%, a difference of 0.78%), Dominican (9.2%, a difference of 4.3%), Yup'ik (10.0%, a difference of 4.4%), and Menominee (9.2%, a difference of 4.5%).
| Demographics | Rating | Rank | Single Mother Households |
| Liberians | 0.0 /100 | #333 | Tragic 8.6% |
| Immigrants | Liberia | 0.0 /100 | #334 | Tragic 8.7% |
| Immigrants | Dominica | 0.0 /100 | #335 | Tragic 8.7% |
| Puerto Ricans | 0.0 /100 | #336 | Tragic 8.7% |
| Navajo | 0.0 /100 | #337 | Tragic 8.8% |
| Cape Verdeans | 0.0 /100 | #338 | Tragic 8.9% |
| Blacks/African Americans | 0.0 /100 | #339 | Tragic 9.0% |
| Lumbee | 0.0 /100 | #340 | Tragic 9.1% |
| Tohono O'odham | 0.0 /100 | #341 | Tragic 9.1% |
| Menominee | 0.0 /100 | #342 | Tragic 9.2% |
| Dominicans | 0.0 /100 | #343 | Tragic 9.2% |
| Immigrants | Dominican Republic | 0.0 /100 | #344 | Tragic 9.5% |
| Immigrants | Cabo Verde | 0.0 /100 | #345 | Tragic 9.6% |
| Yuman | 0.0 /100 | #346 | Tragic 9.6% |
| Yup'ik | 0.0 /100 | #347 | Tragic 10.0% |
Demographics Similar to Poles by Single Mother Households
In terms of single mother households, the demographic groups most similar to Poles are Australian (5.6%, a difference of 0.010%), Immigrants from North Macedonia (5.6%, a difference of 0.070%), Immigrants from Norway (5.6%, a difference of 0.080%), Immigrants from France (5.6%, a difference of 0.10%), and Greek (5.6%, a difference of 0.15%).
| Demographics | Rating | Rank | Single Mother Households |
| Immigrants | Denmark | 99.1 /100 | #55 | Exceptional 5.5% |
| Immigrants | Romania | 99.0 /100 | #56 | Exceptional 5.5% |
| Immigrants | Europe | 99.0 /100 | #57 | Exceptional 5.5% |
| Danes | 98.9 /100 | #58 | Exceptional 5.5% |
| Luxembourgers | 98.7 /100 | #59 | Exceptional 5.6% |
| Immigrants | Norway | 98.7 /100 | #60 | Exceptional 5.6% |
| Australians | 98.7 /100 | #61 | Exceptional 5.6% |
| Poles | 98.6 /100 | #62 | Exceptional 5.6% |
| Immigrants | North Macedonia | 98.6 /100 | #63 | Exceptional 5.6% |
| Immigrants | France | 98.6 /100 | #64 | Exceptional 5.6% |
| Greeks | 98.6 /100 | #65 | Exceptional 5.6% |
| Immigrants | Canada | 98.5 /100 | #66 | Exceptional 5.6% |
| Italians | 98.5 /100 | #67 | Exceptional 5.6% |
| Immigrants | Bulgaria | 98.5 /100 | #68 | Exceptional 5.6% |
| Asians | 98.5 /100 | #69 | Exceptional 5.6% |