Immigrants from Barbados vs Puerto Rican 9th Grade
COMPARE
Immigrants from Barbados
Puerto Rican
9th Grade
9th Grade Comparison
Immigrants from Barbados
Puerto Ricans
93.4%
9TH GRADE
0.0/ 100
METRIC RATING
286th/ 347
METRIC RANK
91.8%
9TH GRADE
0.0/ 100
METRIC RATING
323rd/ 347
METRIC RANK
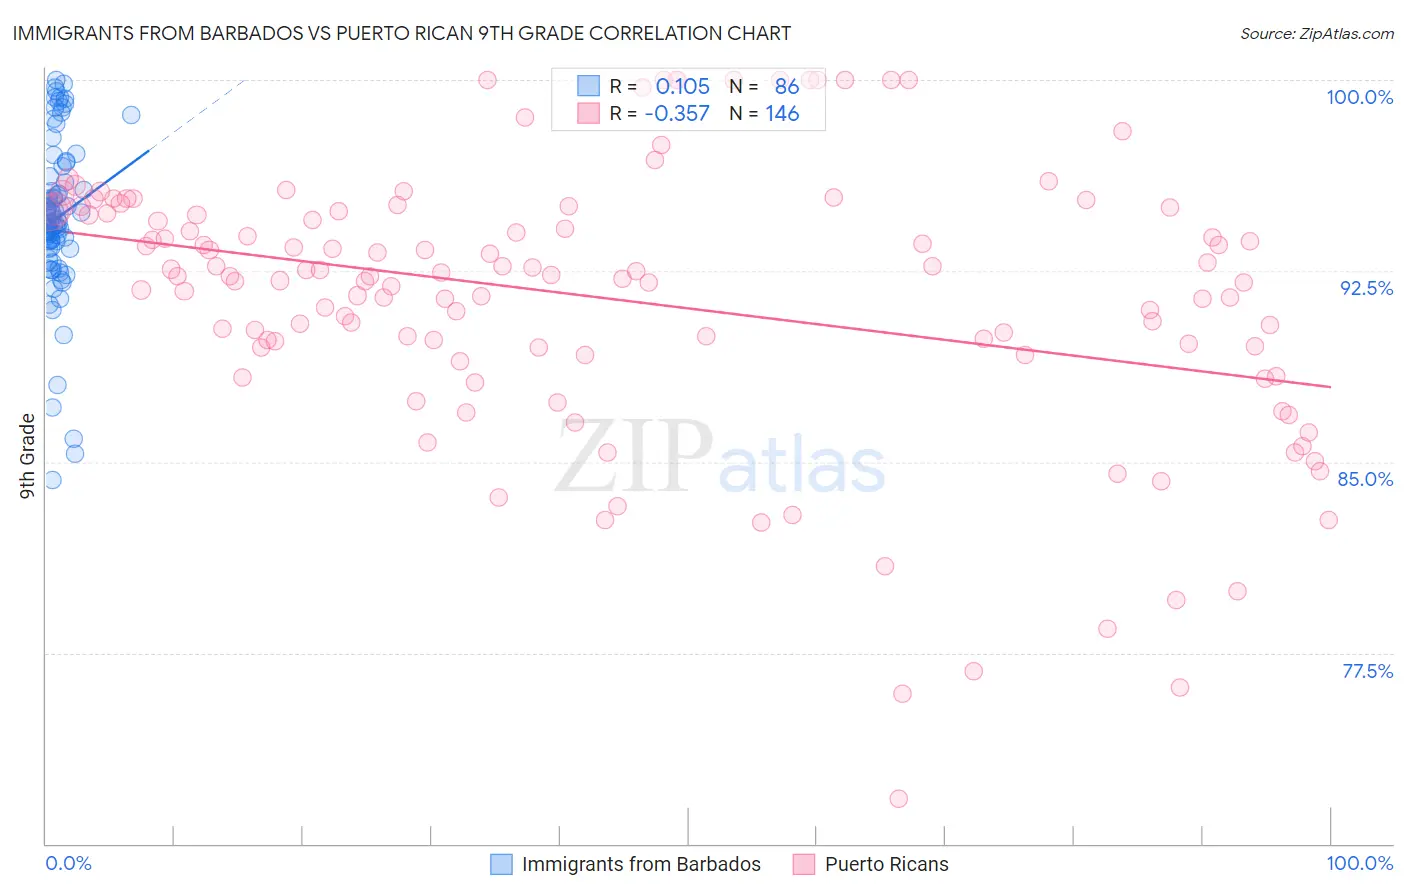
Immigrants from Barbados vs Puerto Rican 9th Grade Correlation Chart
The statistical analysis conducted on geographies consisting of 112,787,165 people shows a poor positive correlation between the proportion of Immigrants from Barbados and percentage of population with at least 9th grade education in the United States with a correlation coefficient (R) of 0.105 and weighted average of 93.4%. Similarly, the statistical analysis conducted on geographies consisting of 528,320,060 people shows a mild negative correlation between the proportion of Puerto Ricans and percentage of population with at least 9th grade education in the United States with a correlation coefficient (R) of -0.357 and weighted average of 91.8%, a difference of 1.7%.
9th Grade Correlation Summary
| Measurement | Immigrants from Barbados | Puerto Rican |
| Minimum | 84.3% | 71.8% |
| Maximum | 100.0% | 100.0% |
| Range | 15.7% | 28.2% |
| Mean | 94.6% | 91.4% |
| Median | 94.4% | 92.3% |
| Interquartile 25% (IQ1) | 93.4% | 89.5% |
| Interquartile 75% (IQ3) | 96.2% | 94.8% |
| Interquartile Range (IQR) | 2.9% | 5.3% |
| Standard Deviation (Sample) | 3.2% | 5.3% |
| Standard Deviation (Population) | 3.1% | 5.3% |
Similar Demographics by 9th Grade
Demographics Similar to Immigrants from Barbados by 9th Grade
In terms of 9th grade, the demographic groups most similar to Immigrants from Barbados are Immigrants from St. Vincent and the Grenadines (93.4%, a difference of 0.010%), Immigrants from Peru (93.4%, a difference of 0.040%), Immigrants from South Eastern Asia (93.3%, a difference of 0.040%), Bangladeshi (93.4%, a difference of 0.080%), and Immigrants from West Indies (93.3%, a difference of 0.10%).
| Demographics | Rating | Rank | 9th Grade |
| Trinidadians and Tobagonians | 0.1 /100 | #279 | Tragic 93.7% |
| Taiwanese | 0.1 /100 | #280 | Tragic 93.6% |
| Immigrants | Trinidad and Tobago | 0.1 /100 | #281 | Tragic 93.6% |
| Malaysians | 0.0 /100 | #282 | Tragic 93.5% |
| Barbadians | 0.0 /100 | #283 | Tragic 93.5% |
| Bangladeshis | 0.0 /100 | #284 | Tragic 93.4% |
| Immigrants | Peru | 0.0 /100 | #285 | Tragic 93.4% |
| Immigrants | Barbados | 0.0 /100 | #286 | Tragic 93.4% |
| Immigrants | St. Vincent and the Grenadines | 0.0 /100 | #287 | Tragic 93.4% |
| Immigrants | South Eastern Asia | 0.0 /100 | #288 | Tragic 93.3% |
| Immigrants | West Indies | 0.0 /100 | #289 | Tragic 93.3% |
| Pennsylvania Germans | 0.0 /100 | #290 | Tragic 93.3% |
| British West Indians | 0.0 /100 | #291 | Tragic 93.2% |
| Immigrants | Laos | 0.0 /100 | #292 | Tragic 93.2% |
| Sri Lankans | 0.0 /100 | #293 | Tragic 93.2% |
Demographics Similar to Puerto Ricans by 9th Grade
In terms of 9th grade, the demographic groups most similar to Puerto Ricans are Belizean (91.8%, a difference of 0.0%), Immigrants from Ecuador (91.8%, a difference of 0.030%), Immigrants from Belize (91.8%, a difference of 0.060%), Nicaraguan (91.9%, a difference of 0.090%), and Ecuadorian (91.9%, a difference of 0.14%).
| Demographics | Rating | Rank | 9th Grade |
| Cape Verdeans | 0.0 /100 | #316 | Tragic 92.2% |
| Immigrants | Cuba | 0.0 /100 | #317 | Tragic 92.2% |
| Nepalese | 0.0 /100 | #318 | Tragic 92.0% |
| Ecuadorians | 0.0 /100 | #319 | Tragic 91.9% |
| Nicaraguans | 0.0 /100 | #320 | Tragic 91.9% |
| Immigrants | Ecuador | 0.0 /100 | #321 | Tragic 91.8% |
| Belizeans | 0.0 /100 | #322 | Tragic 91.8% |
| Puerto Ricans | 0.0 /100 | #323 | Tragic 91.8% |
| Immigrants | Belize | 0.0 /100 | #324 | Tragic 91.8% |
| Central American Indians | 0.0 /100 | #325 | Tragic 91.5% |
| Immigrants | Armenia | 0.0 /100 | #326 | Tragic 91.4% |
| Immigrants | Nicaragua | 0.0 /100 | #327 | Tragic 91.3% |
| Dominicans | 0.0 /100 | #328 | Tragic 91.1% |
| Hondurans | 0.0 /100 | #329 | Tragic 91.0% |
| Immigrants | Cabo Verde | 0.0 /100 | #330 | Tragic 90.9% |