Immigrants from Barbados vs Cambodian Female Poverty
COMPARE
Immigrants from Barbados
Cambodian
Female Poverty
Female Poverty Comparison
Immigrants from Barbados
Cambodians
16.0%
FEMALE POVERTY
0.0/ 100
METRIC RATING
275th/ 347
METRIC RANK
12.2%
FEMALE POVERTY
97.5/ 100
METRIC RATING
72nd/ 347
METRIC RANK
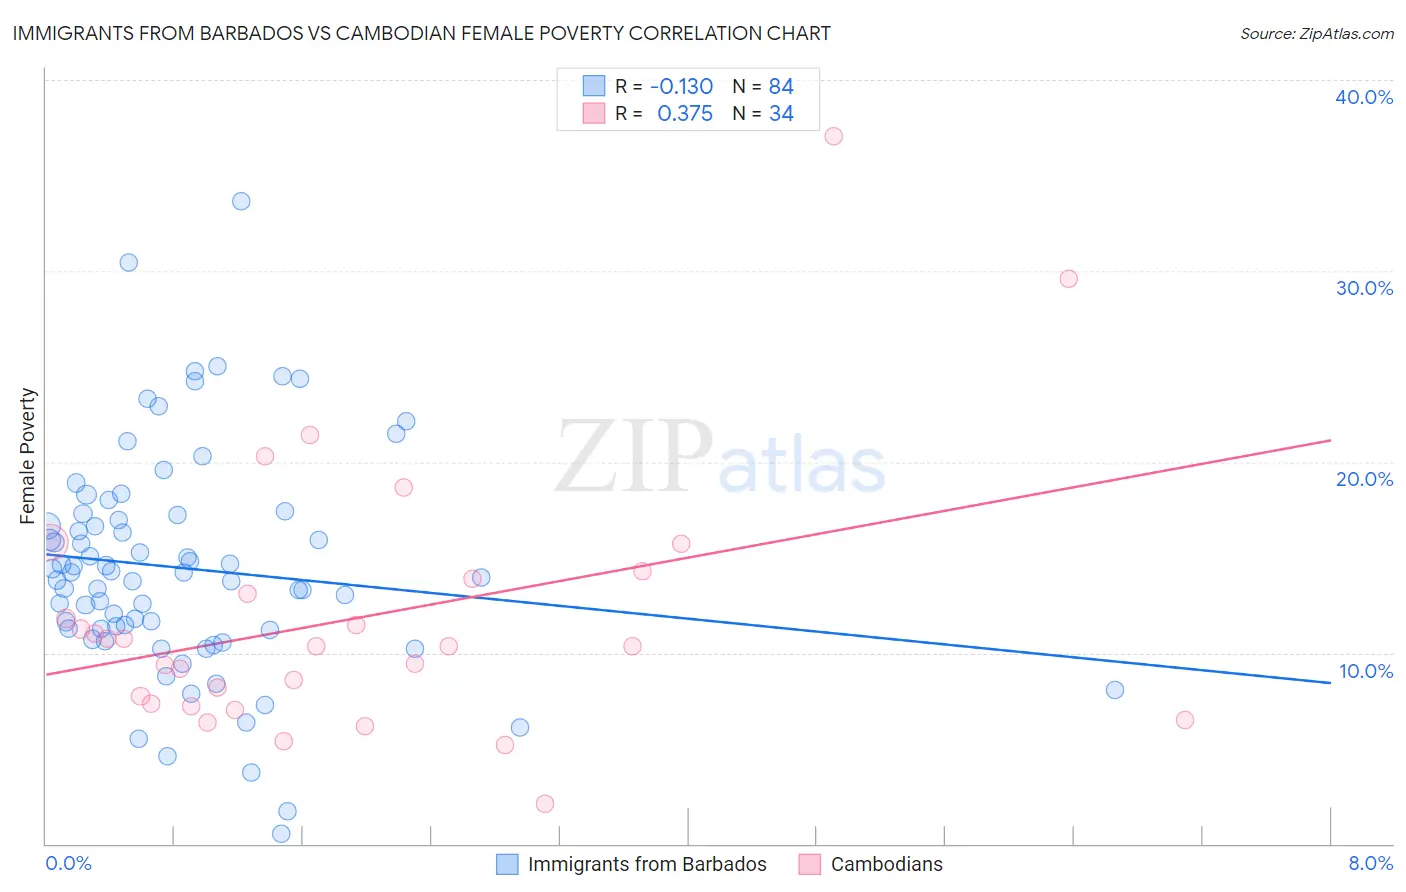
Immigrants from Barbados vs Cambodian Female Poverty Correlation Chart
The statistical analysis conducted on geographies consisting of 112,761,871 people shows a poor negative correlation between the proportion of Immigrants from Barbados and poverty level among females in the United States with a correlation coefficient (R) of -0.130 and weighted average of 16.0%. Similarly, the statistical analysis conducted on geographies consisting of 102,481,907 people shows a mild positive correlation between the proportion of Cambodians and poverty level among females in the United States with a correlation coefficient (R) of 0.375 and weighted average of 12.2%, a difference of 30.2%.
Female Poverty Correlation Summary
| Measurement | Immigrants from Barbados | Cambodian |
| Minimum | 0.50% | 2.1% |
| Maximum | 33.6% | 37.0% |
| Range | 33.1% | 34.9% |
| Mean | 14.4% | 11.9% |
| Median | 14.1% | 10.4% |
| Interquartile 25% (IQ1) | 11.2% | 7.3% |
| Interquartile 75% (IQ3) | 17.1% | 13.9% |
| Interquartile Range (IQR) | 5.8% | 6.5% |
| Standard Deviation (Sample) | 5.9% | 7.0% |
| Standard Deviation (Population) | 5.8% | 6.9% |
Similar Demographics by Female Poverty
Demographics Similar to Immigrants from Barbados by Female Poverty
In terms of female poverty, the demographic groups most similar to Immigrants from Barbados are Belizean (15.9%, a difference of 0.070%), Haitian (15.9%, a difference of 0.070%), Barbadian (15.9%, a difference of 0.070%), Central American (16.0%, a difference of 0.13%), and Immigrants from St. Vincent and the Grenadines (15.9%, a difference of 0.30%).
| Demographics | Rating | Rank | Female Poverty |
| Immigrants | Nicaragua | 0.1 /100 | #268 | Tragic 15.8% |
| Iroquois | 0.1 /100 | #269 | Tragic 15.8% |
| Chickasaw | 0.1 /100 | #270 | Tragic 15.9% |
| Immigrants | St. Vincent and the Grenadines | 0.0 /100 | #271 | Tragic 15.9% |
| Belizeans | 0.0 /100 | #272 | Tragic 15.9% |
| Haitians | 0.0 /100 | #273 | Tragic 15.9% |
| Barbadians | 0.0 /100 | #274 | Tragic 15.9% |
| Immigrants | Barbados | 0.0 /100 | #275 | Tragic 16.0% |
| Central Americans | 0.0 /100 | #276 | Tragic 16.0% |
| Bangladeshis | 0.0 /100 | #277 | Tragic 16.0% |
| Immigrants | West Indies | 0.0 /100 | #278 | Tragic 16.1% |
| Immigrants | Bahamas | 0.0 /100 | #279 | Tragic 16.1% |
| Vietnamese | 0.0 /100 | #280 | Tragic 16.1% |
| West Indians | 0.0 /100 | #281 | Tragic 16.1% |
| Immigrants | Haiti | 0.0 /100 | #282 | Tragic 16.1% |
Demographics Similar to Cambodians by Female Poverty
In terms of female poverty, the demographic groups most similar to Cambodians are Zimbabwean (12.3%, a difference of 0.020%), Carpatho Rusyn (12.2%, a difference of 0.030%), Immigrants from Canada (12.3%, a difference of 0.030%), European (12.3%, a difference of 0.15%), and Immigrants from Belgium (12.2%, a difference of 0.16%).
| Demographics | Rating | Rank | Female Poverty |
| Indians (Asian) | 97.9 /100 | #65 | Exceptional 12.2% |
| Austrians | 97.9 /100 | #66 | Exceptional 12.2% |
| Immigrants | Eastern Asia | 97.8 /100 | #67 | Exceptional 12.2% |
| Immigrants | Netherlands | 97.8 /100 | #68 | Exceptional 12.2% |
| Swiss | 97.7 /100 | #69 | Exceptional 12.2% |
| Immigrants | Belgium | 97.7 /100 | #70 | Exceptional 12.2% |
| Carpatho Rusyns | 97.6 /100 | #71 | Exceptional 12.2% |
| Cambodians | 97.5 /100 | #72 | Exceptional 12.2% |
| Zimbabweans | 97.5 /100 | #73 | Exceptional 12.3% |
| Immigrants | Canada | 97.5 /100 | #74 | Exceptional 12.3% |
| Europeans | 97.4 /100 | #75 | Exceptional 12.3% |
| Immigrants | Eastern Europe | 97.2 /100 | #76 | Exceptional 12.3% |
| Serbians | 97.2 /100 | #77 | Exceptional 12.3% |
| Egyptians | 97.2 /100 | #78 | Exceptional 12.3% |
| Immigrants | North America | 97.1 /100 | #79 | Exceptional 12.3% |