German vs Bhutanese Male Poverty
COMPARE
German
Bhutanese
Male Poverty
Male Poverty Comparison
Germans
Bhutanese
10.1%
MALE POVERTY
98.3/ 100
METRIC RATING
55th/ 347
METRIC RANK
9.5%
MALE POVERTY
99.8/ 100
METRIC RATING
15th/ 347
METRIC RANK
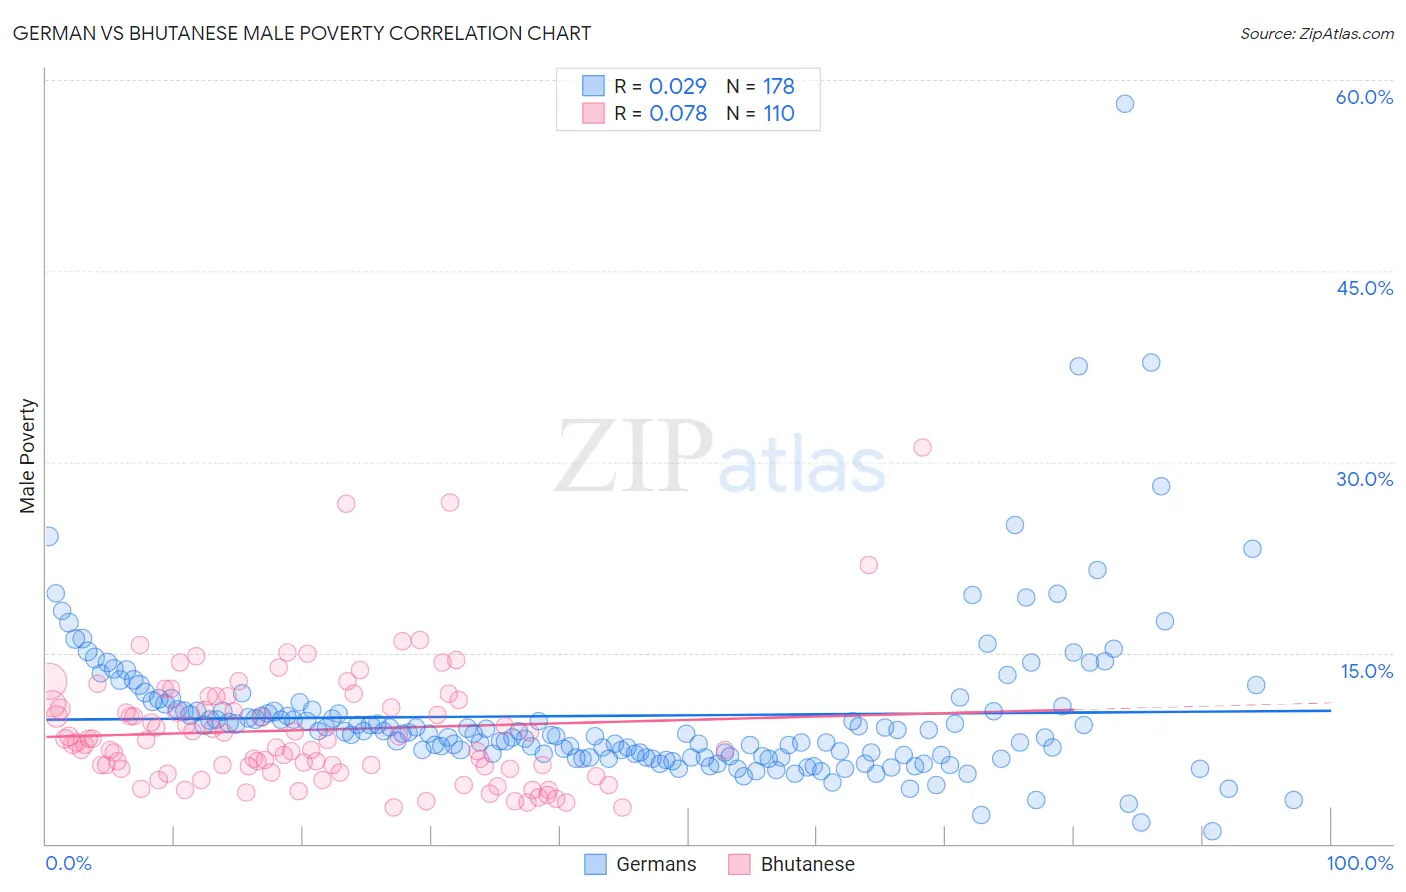
German vs Bhutanese Male Poverty Correlation Chart
The statistical analysis conducted on geographies consisting of 578,875,550 people shows no correlation between the proportion of Germans and poverty level among males in the United States with a correlation coefficient (R) of 0.029 and weighted average of 10.1%. Similarly, the statistical analysis conducted on geographies consisting of 454,976,396 people shows a slight positive correlation between the proportion of Bhutanese and poverty level among males in the United States with a correlation coefficient (R) of 0.078 and weighted average of 9.5%, a difference of 6.5%.
Male Poverty Correlation Summary
| Measurement | German | Bhutanese |
| Minimum | 1.0% | 2.8% |
| Maximum | 58.2% | 31.2% |
| Range | 57.2% | 28.3% |
| Mean | 10.1% | 8.9% |
| Median | 8.7% | 8.0% |
| Interquartile 25% (IQ1) | 6.9% | 5.9% |
| Interquartile 75% (IQ3) | 10.5% | 11.0% |
| Interquartile Range (IQR) | 3.7% | 5.1% |
| Standard Deviation (Sample) | 6.3% | 4.9% |
| Standard Deviation (Population) | 6.3% | 4.8% |
Similar Demographics by Male Poverty
Demographics Similar to Germans by Male Poverty
In terms of male poverty, the demographic groups most similar to Germans are Immigrants from Bulgaria (10.1%, a difference of 0.21%), Immigrants from Austria (10.0%, a difference of 0.29%), Estonian (10.1%, a difference of 0.35%), Scandinavian (10.1%, a difference of 0.42%), and Immigrants from Europe (10.1%, a difference of 0.56%).
| Demographics | Rating | Rank | Male Poverty |
| Immigrants | Japan | 98.8 /100 | #48 | Exceptional 10.0% |
| Slovenes | 98.8 /100 | #49 | Exceptional 10.0% |
| Immigrants | Philippines | 98.7 /100 | #50 | Exceptional 10.0% |
| Immigrants | Croatia | 98.7 /100 | #51 | Exceptional 10.0% |
| Asians | 98.7 /100 | #52 | Exceptional 10.0% |
| Immigrants | Czechoslovakia | 98.6 /100 | #53 | Exceptional 10.0% |
| Immigrants | Austria | 98.5 /100 | #54 | Exceptional 10.0% |
| Germans | 98.3 /100 | #55 | Exceptional 10.1% |
| Immigrants | Bulgaria | 98.2 /100 | #56 | Exceptional 10.1% |
| Estonians | 98.1 /100 | #57 | Exceptional 10.1% |
| Scandinavians | 98.0 /100 | #58 | Exceptional 10.1% |
| Immigrants | Europe | 97.9 /100 | #59 | Exceptional 10.1% |
| Ukrainians | 97.9 /100 | #60 | Exceptional 10.1% |
| Austrians | 97.8 /100 | #61 | Exceptional 10.1% |
| Immigrants | Italy | 97.8 /100 | #62 | Exceptional 10.2% |
Demographics Similar to Bhutanese by Male Poverty
In terms of male poverty, the demographic groups most similar to Bhutanese are Immigrants from North Macedonia (9.4%, a difference of 0.29%), Luxembourger (9.5%, a difference of 0.52%), Norwegian (9.5%, a difference of 0.65%), Immigrants from Lithuania (9.4%, a difference of 0.67%), and Immigrants from Bolivia (9.4%, a difference of 0.79%).
| Demographics | Rating | Rank | Male Poverty |
| Filipinos | 99.9 /100 | #8 | Exceptional 9.2% |
| Immigrants | South Central Asia | 99.9 /100 | #9 | Exceptional 9.3% |
| Bulgarians | 99.9 /100 | #10 | Exceptional 9.3% |
| Bolivians | 99.9 /100 | #11 | Exceptional 9.4% |
| Immigrants | Bolivia | 99.9 /100 | #12 | Exceptional 9.4% |
| Immigrants | Lithuania | 99.9 /100 | #13 | Exceptional 9.4% |
| Immigrants | North Macedonia | 99.8 /100 | #14 | Exceptional 9.4% |
| Bhutanese | 99.8 /100 | #15 | Exceptional 9.5% |
| Luxembourgers | 99.8 /100 | #16 | Exceptional 9.5% |
| Norwegians | 99.8 /100 | #17 | Exceptional 9.5% |
| Lithuanians | 99.8 /100 | #18 | Exceptional 9.5% |
| Immigrants | Hong Kong | 99.7 /100 | #19 | Exceptional 9.6% |
| Latvians | 99.7 /100 | #20 | Exceptional 9.6% |
| Immigrants | Scotland | 99.7 /100 | #21 | Exceptional 9.6% |
| Croatians | 99.7 /100 | #22 | Exceptional 9.6% |