Immigrants from West Indies vs Bhutanese Male Poverty
COMPARE
Immigrants from West Indies
Bhutanese
Male Poverty
Male Poverty Comparison
Immigrants from West Indies
Bhutanese
13.5%
MALE POVERTY
0.0/ 100
METRIC RATING
274th/ 347
METRIC RANK
9.5%
MALE POVERTY
99.8/ 100
METRIC RATING
15th/ 347
METRIC RANK
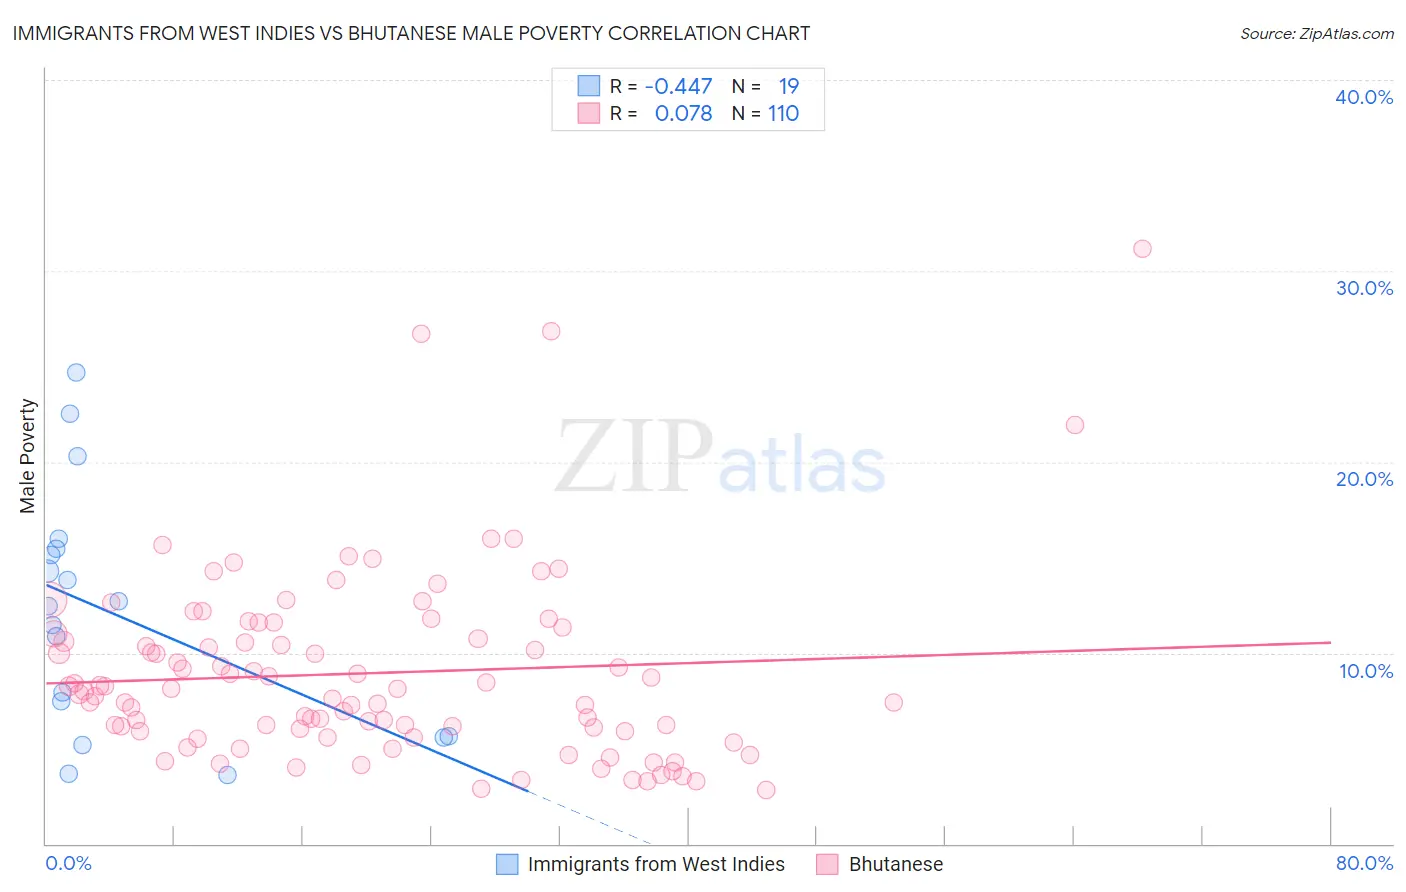
Immigrants from West Indies vs Bhutanese Male Poverty Correlation Chart
The statistical analysis conducted on geographies consisting of 72,454,628 people shows a moderate negative correlation between the proportion of Immigrants from West Indies and poverty level among males in the United States with a correlation coefficient (R) of -0.447 and weighted average of 13.5%. Similarly, the statistical analysis conducted on geographies consisting of 454,976,396 people shows a slight positive correlation between the proportion of Bhutanese and poverty level among males in the United States with a correlation coefficient (R) of 0.078 and weighted average of 9.5%, a difference of 42.6%.
Male Poverty Correlation Summary
| Measurement | Immigrants from West Indies | Bhutanese |
| Minimum | 3.6% | 2.8% |
| Maximum | 24.7% | 31.2% |
| Range | 21.1% | 28.3% |
| Mean | 12.0% | 8.9% |
| Median | 12.5% | 8.0% |
| Interquartile 25% (IQ1) | 5.6% | 5.9% |
| Interquartile 75% (IQ3) | 15.4% | 11.0% |
| Interquartile Range (IQR) | 9.8% | 5.1% |
| Standard Deviation (Sample) | 6.2% | 4.9% |
| Standard Deviation (Population) | 6.0% | 4.8% |
Similar Demographics by Male Poverty
Demographics Similar to Immigrants from West Indies by Male Poverty
In terms of male poverty, the demographic groups most similar to Immigrants from West Indies are Chickasaw (13.5%, a difference of 0.070%), Immigrants from Bahamas (13.5%, a difference of 0.37%), Barbadian (13.6%, a difference of 0.62%), Immigrants from Latin America (13.6%, a difference of 0.82%), and Bangladeshi (13.6%, a difference of 0.97%).
| Demographics | Rating | Rank | Male Poverty |
| Immigrants | Jamaica | 0.1 /100 | #267 | Tragic 13.3% |
| Sub-Saharan Africans | 0.1 /100 | #268 | Tragic 13.3% |
| Guyanese | 0.0 /100 | #269 | Tragic 13.3% |
| Cree | 0.0 /100 | #270 | Tragic 13.3% |
| Spanish Americans | 0.0 /100 | #271 | Tragic 13.4% |
| Immigrants | Bahamas | 0.0 /100 | #272 | Tragic 13.5% |
| Chickasaw | 0.0 /100 | #273 | Tragic 13.5% |
| Immigrants | West Indies | 0.0 /100 | #274 | Tragic 13.5% |
| Barbadians | 0.0 /100 | #275 | Tragic 13.6% |
| Immigrants | Latin America | 0.0 /100 | #276 | Tragic 13.6% |
| Bangladeshis | 0.0 /100 | #277 | Tragic 13.6% |
| Belizeans | 0.0 /100 | #278 | Tragic 13.6% |
| Haitians | 0.0 /100 | #279 | Tragic 13.7% |
| Mexicans | 0.0 /100 | #280 | Tragic 13.7% |
| Yaqui | 0.0 /100 | #281 | Tragic 13.7% |
Demographics Similar to Bhutanese by Male Poverty
In terms of male poverty, the demographic groups most similar to Bhutanese are Immigrants from North Macedonia (9.4%, a difference of 0.29%), Luxembourger (9.5%, a difference of 0.52%), Norwegian (9.5%, a difference of 0.65%), Immigrants from Lithuania (9.4%, a difference of 0.67%), and Immigrants from Bolivia (9.4%, a difference of 0.79%).
| Demographics | Rating | Rank | Male Poverty |
| Filipinos | 99.9 /100 | #8 | Exceptional 9.2% |
| Immigrants | South Central Asia | 99.9 /100 | #9 | Exceptional 9.3% |
| Bulgarians | 99.9 /100 | #10 | Exceptional 9.3% |
| Bolivians | 99.9 /100 | #11 | Exceptional 9.4% |
| Immigrants | Bolivia | 99.9 /100 | #12 | Exceptional 9.4% |
| Immigrants | Lithuania | 99.9 /100 | #13 | Exceptional 9.4% |
| Immigrants | North Macedonia | 99.8 /100 | #14 | Exceptional 9.4% |
| Bhutanese | 99.8 /100 | #15 | Exceptional 9.5% |
| Luxembourgers | 99.8 /100 | #16 | Exceptional 9.5% |
| Norwegians | 99.8 /100 | #17 | Exceptional 9.5% |
| Lithuanians | 99.8 /100 | #18 | Exceptional 9.5% |
| Immigrants | Hong Kong | 99.7 /100 | #19 | Exceptional 9.6% |
| Latvians | 99.7 /100 | #20 | Exceptional 9.6% |
| Immigrants | Scotland | 99.7 /100 | #21 | Exceptional 9.6% |
| Croatians | 99.7 /100 | #22 | Exceptional 9.6% |