Immigrants from Northern Africa vs Nepalese Single Male Poverty
COMPARE
Immigrants from Northern Africa
Nepalese
Single Male Poverty
Single Male Poverty Comparison
Immigrants from Northern Africa
Nepalese
11.9%
SINGLE MALE POVERTY
99.4/ 100
METRIC RATING
76th/ 347
METRIC RANK
11.6%
SINGLE MALE POVERTY
99.9/ 100
METRIC RATING
47th/ 347
METRIC RANK
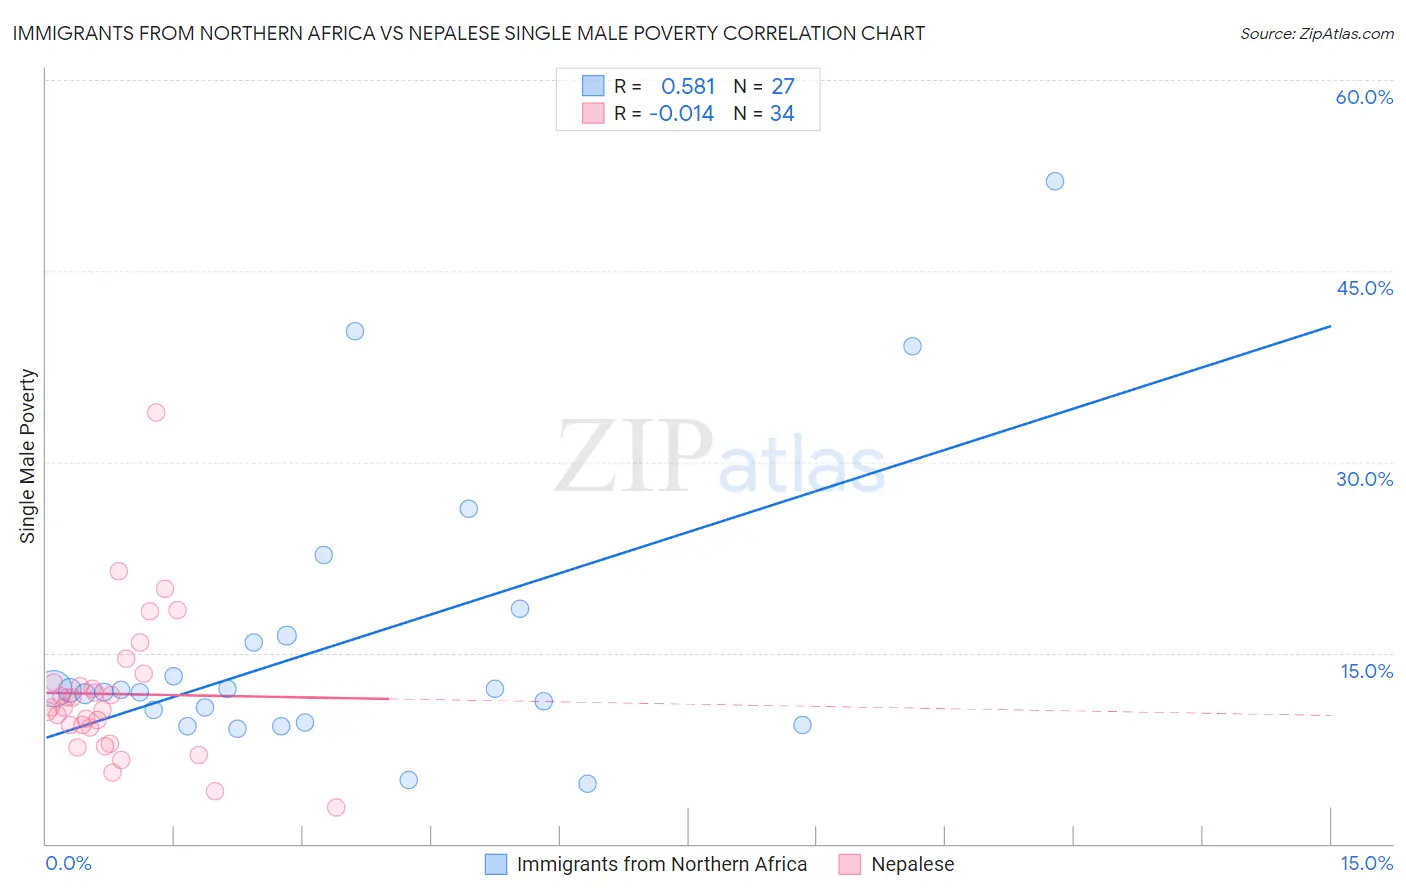
Immigrants from Northern Africa vs Nepalese Single Male Poverty Correlation Chart
The statistical analysis conducted on geographies consisting of 289,323,815 people shows a substantial positive correlation between the proportion of Immigrants from Northern Africa and poverty level among single males in the United States with a correlation coefficient (R) of 0.581 and weighted average of 11.9%. Similarly, the statistical analysis conducted on geographies consisting of 24,210,854 people shows no correlation between the proportion of Nepalese and poverty level among single males in the United States with a correlation coefficient (R) of -0.014 and weighted average of 11.6%, a difference of 3.1%.
Single Male Poverty Correlation Summary
| Measurement | Immigrants from Northern Africa | Nepalese |
| Minimum | 4.7% | 2.8% |
| Maximum | 52.0% | 33.9% |
| Range | 47.3% | 31.1% |
| Mean | 15.9% | 11.8% |
| Median | 12.0% | 10.7% |
| Interquartile 25% (IQ1) | 9.6% | 9.1% |
| Interquartile 75% (IQ3) | 16.4% | 12.7% |
| Interquartile Range (IQR) | 6.8% | 3.6% |
| Standard Deviation (Sample) | 11.2% | 5.7% |
| Standard Deviation (Population) | 11.0% | 5.6% |
Similar Demographics by Single Male Poverty
Demographics Similar to Immigrants from Northern Africa by Single Male Poverty
In terms of single male poverty, the demographic groups most similar to Immigrants from Northern Africa are Uruguayan (11.9%, a difference of 0.020%), Chilean (11.9%, a difference of 0.22%), Immigrants from Malaysia (12.0%, a difference of 0.26%), Argentinean (11.9%, a difference of 0.27%), and Immigrants from Argentina (11.9%, a difference of 0.40%).
| Demographics | Rating | Rank | Single Male Poverty |
| Immigrants | Russia | 99.6 /100 | #69 | Exceptional 11.9% |
| Immigrants | Nepal | 99.6 /100 | #70 | Exceptional 11.9% |
| Immigrants | Greece | 99.6 /100 | #71 | Exceptional 11.9% |
| Immigrants | Argentina | 99.5 /100 | #72 | Exceptional 11.9% |
| Argentineans | 99.5 /100 | #73 | Exceptional 11.9% |
| Chileans | 99.5 /100 | #74 | Exceptional 11.9% |
| Uruguayans | 99.4 /100 | #75 | Exceptional 11.9% |
| Immigrants | Northern Africa | 99.4 /100 | #76 | Exceptional 11.9% |
| Immigrants | Malaysia | 99.2 /100 | #77 | Exceptional 12.0% |
| Immigrants | Venezuela | 99.1 /100 | #78 | Exceptional 12.0% |
| Immigrants | Belgium | 99.0 /100 | #79 | Exceptional 12.0% |
| Armenians | 98.7 /100 | #80 | Exceptional 12.1% |
| Immigrants | South America | 98.7 /100 | #81 | Exceptional 12.1% |
| Immigrants | Colombia | 98.6 /100 | #82 | Exceptional 12.1% |
| Immigrants | Chile | 98.6 /100 | #83 | Exceptional 12.1% |
Demographics Similar to Nepalese by Single Male Poverty
In terms of single male poverty, the demographic groups most similar to Nepalese are Immigrants from Indonesia (11.6%, a difference of 0.080%), Tlingit-Haida (11.6%, a difference of 0.10%), Immigrants from Lithuania (11.6%, a difference of 0.15%), Immigrants from Bulgaria (11.6%, a difference of 0.20%), and Paraguayan (11.6%, a difference of 0.26%).
| Demographics | Rating | Rank | Single Male Poverty |
| Immigrants | Korea | 100.0 /100 | #40 | Exceptional 11.5% |
| Immigrants | Iraq | 99.9 /100 | #41 | Exceptional 11.5% |
| Egyptians | 99.9 /100 | #42 | Exceptional 11.5% |
| Immigrants | Peru | 99.9 /100 | #43 | Exceptional 11.5% |
| Immigrants | Cameroon | 99.9 /100 | #44 | Exceptional 11.5% |
| Immigrants | Poland | 99.9 /100 | #45 | Exceptional 11.5% |
| Immigrants | Bulgaria | 99.9 /100 | #46 | Exceptional 11.6% |
| Nepalese | 99.9 /100 | #47 | Exceptional 11.6% |
| Immigrants | Indonesia | 99.9 /100 | #48 | Exceptional 11.6% |
| Tlingit-Haida | 99.9 /100 | #49 | Exceptional 11.6% |
| Immigrants | Lithuania | 99.9 /100 | #50 | Exceptional 11.6% |
| Paraguayans | 99.9 /100 | #51 | Exceptional 11.6% |
| Samoans | 99.9 /100 | #52 | Exceptional 11.7% |
| Bulgarians | 99.9 /100 | #53 | Exceptional 11.7% |
| Immigrants | Uzbekistan | 99.9 /100 | #54 | Exceptional 11.7% |