Portuguese vs Nepalese Single Male Poverty
COMPARE
Portuguese
Nepalese
Single Male Poverty
Single Male Poverty Comparison
Portuguese
Nepalese
12.9%
SINGLE MALE POVERTY
30.2/ 100
METRIC RATING
189th/ 347
METRIC RANK
11.6%
SINGLE MALE POVERTY
99.9/ 100
METRIC RATING
47th/ 347
METRIC RANK
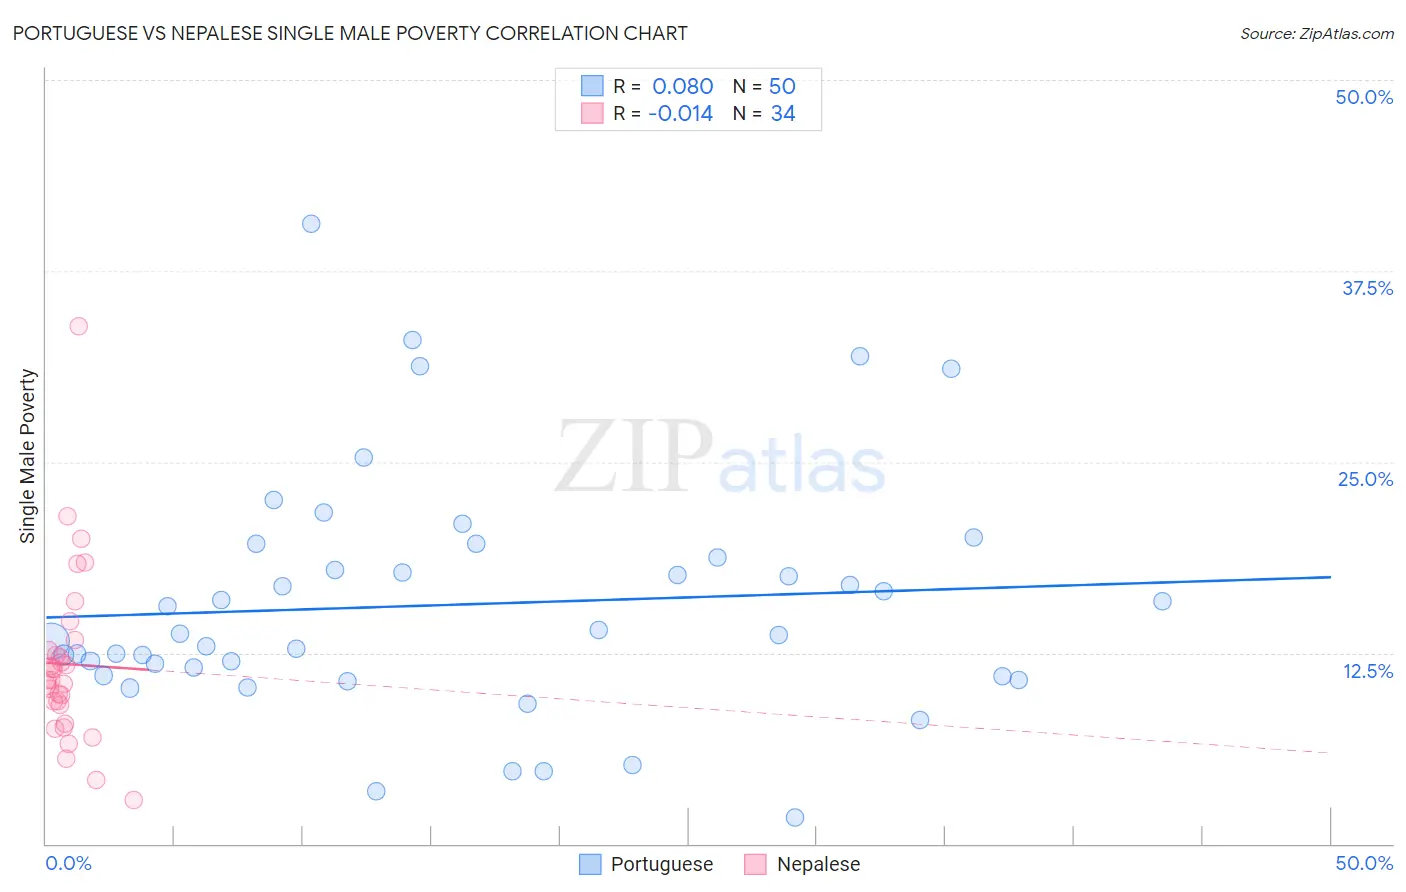
Portuguese vs Nepalese Single Male Poverty Correlation Chart
The statistical analysis conducted on geographies consisting of 390,984,789 people shows a slight positive correlation between the proportion of Portuguese and poverty level among single males in the United States with a correlation coefficient (R) of 0.080 and weighted average of 12.9%. Similarly, the statistical analysis conducted on geographies consisting of 24,210,854 people shows no correlation between the proportion of Nepalese and poverty level among single males in the United States with a correlation coefficient (R) of -0.014 and weighted average of 11.6%, a difference of 11.7%.
Single Male Poverty Correlation Summary
| Measurement | Portuguese | Nepalese |
| Minimum | 1.7% | 2.8% |
| Maximum | 40.6% | 33.9% |
| Range | 38.8% | 31.1% |
| Mean | 15.7% | 11.8% |
| Median | 13.7% | 10.7% |
| Interquartile 25% (IQ1) | 11.0% | 9.1% |
| Interquartile 75% (IQ3) | 18.7% | 12.7% |
| Interquartile Range (IQR) | 7.7% | 3.6% |
| Standard Deviation (Sample) | 7.9% | 5.7% |
| Standard Deviation (Population) | 7.8% | 5.6% |
Similar Demographics by Single Male Poverty
Demographics Similar to Portuguese by Single Male Poverty
In terms of single male poverty, the demographic groups most similar to Portuguese are Macedonian (12.9%, a difference of 0.080%), Nigerian (12.9%, a difference of 0.10%), Immigrants from Kuwait (12.9%, a difference of 0.10%), Norwegian (12.9%, a difference of 0.11%), and Immigrants from Trinidad and Tobago (12.9%, a difference of 0.14%).
| Demographics | Rating | Rank | Single Male Poverty |
| Moroccans | 36.8 /100 | #182 | Fair 12.9% |
| Immigrants | West Indies | 33.0 /100 | #183 | Fair 12.9% |
| Immigrants | Trinidad and Tobago | 32.5 /100 | #184 | Fair 12.9% |
| Norwegians | 32.0 /100 | #185 | Fair 12.9% |
| Nigerians | 31.9 /100 | #186 | Fair 12.9% |
| Immigrants | Kuwait | 31.9 /100 | #187 | Fair 12.9% |
| Macedonians | 31.5 /100 | #188 | Fair 12.9% |
| Portuguese | 30.2 /100 | #189 | Fair 12.9% |
| Arabs | 27.0 /100 | #190 | Fair 13.0% |
| Immigrants | Thailand | 26.6 /100 | #191 | Fair 13.0% |
| Immigrants | Jamaica | 26.5 /100 | #192 | Fair 13.0% |
| Immigrants | South Africa | 26.1 /100 | #193 | Fair 13.0% |
| Liberians | 25.2 /100 | #194 | Fair 13.0% |
| Immigrants | England | 23.4 /100 | #195 | Fair 13.0% |
| Immigrants | Grenada | 23.1 /100 | #196 | Fair 13.0% |
Demographics Similar to Nepalese by Single Male Poverty
In terms of single male poverty, the demographic groups most similar to Nepalese are Immigrants from Indonesia (11.6%, a difference of 0.080%), Tlingit-Haida (11.6%, a difference of 0.10%), Immigrants from Lithuania (11.6%, a difference of 0.15%), Immigrants from Bulgaria (11.6%, a difference of 0.20%), and Paraguayan (11.6%, a difference of 0.26%).
| Demographics | Rating | Rank | Single Male Poverty |
| Immigrants | Korea | 100.0 /100 | #40 | Exceptional 11.5% |
| Immigrants | Iraq | 99.9 /100 | #41 | Exceptional 11.5% |
| Egyptians | 99.9 /100 | #42 | Exceptional 11.5% |
| Immigrants | Peru | 99.9 /100 | #43 | Exceptional 11.5% |
| Immigrants | Cameroon | 99.9 /100 | #44 | Exceptional 11.5% |
| Immigrants | Poland | 99.9 /100 | #45 | Exceptional 11.5% |
| Immigrants | Bulgaria | 99.9 /100 | #46 | Exceptional 11.6% |
| Nepalese | 99.9 /100 | #47 | Exceptional 11.6% |
| Immigrants | Indonesia | 99.9 /100 | #48 | Exceptional 11.6% |
| Tlingit-Haida | 99.9 /100 | #49 | Exceptional 11.6% |
| Immigrants | Lithuania | 99.9 /100 | #50 | Exceptional 11.6% |
| Paraguayans | 99.9 /100 | #51 | Exceptional 11.6% |
| Samoans | 99.9 /100 | #52 | Exceptional 11.7% |
| Bulgarians | 99.9 /100 | #53 | Exceptional 11.7% |
| Immigrants | Uzbekistan | 99.9 /100 | #54 | Exceptional 11.7% |