Immigrants from Africa vs Thai Family Poverty
COMPARE
Immigrants from Africa
Thai
Family Poverty
Family Poverty Comparison
Immigrants from Africa
Thais
9.9%
FAMILY POVERTY
4.3/ 100
METRIC RATING
223rd/ 347
METRIC RANK
6.7%
FAMILY POVERTY
100.0/ 100
METRIC RATING
5th/ 347
METRIC RANK
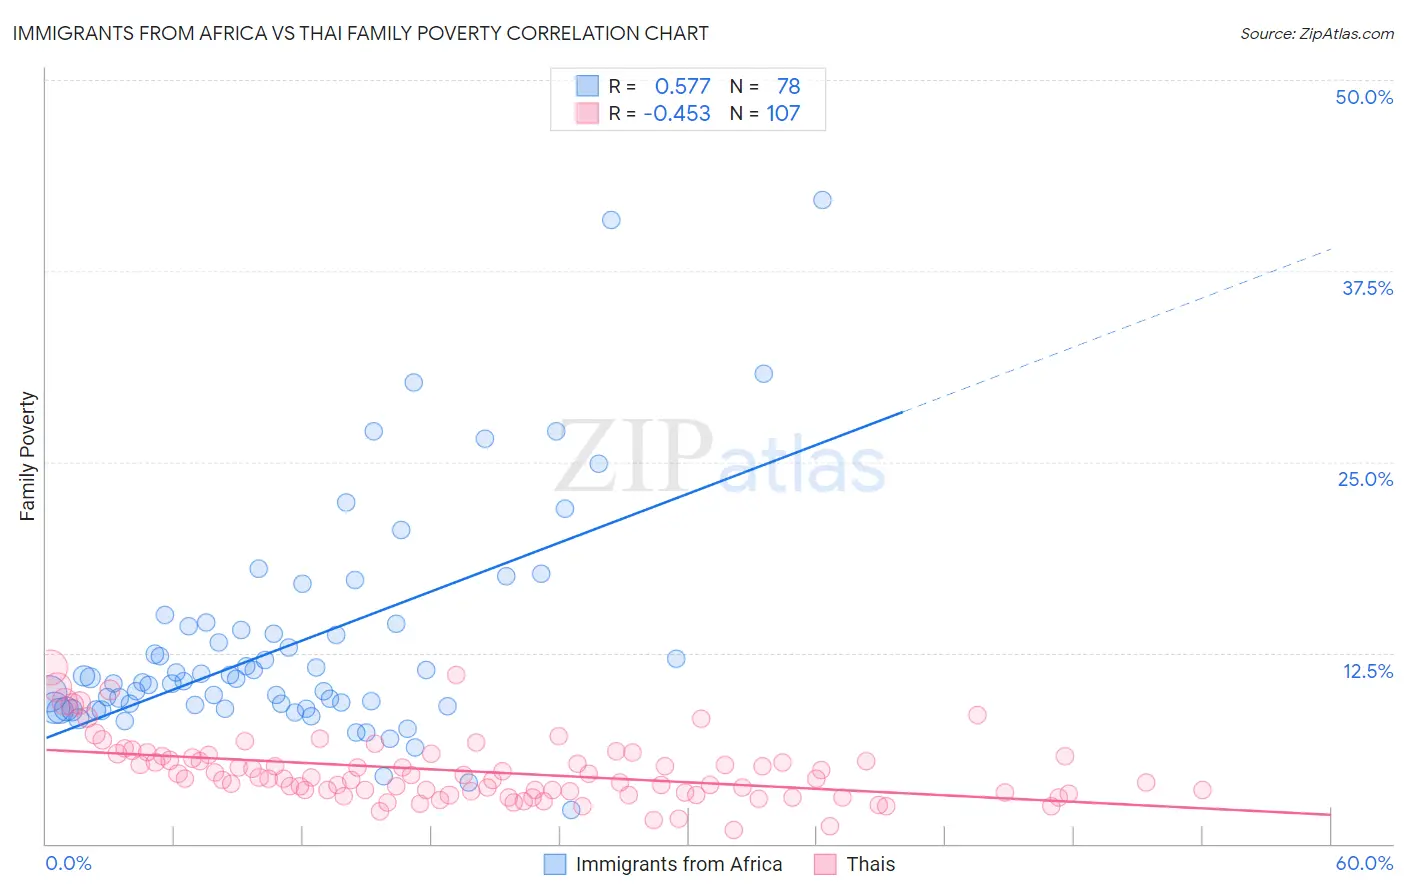
Immigrants from Africa vs Thai Family Poverty Correlation Chart
The statistical analysis conducted on geographies consisting of 467,521,718 people shows a substantial positive correlation between the proportion of Immigrants from Africa and poverty level among families in the United States with a correlation coefficient (R) of 0.577 and weighted average of 9.9%. Similarly, the statistical analysis conducted on geographies consisting of 473,767,426 people shows a moderate negative correlation between the proportion of Thais and poverty level among families in the United States with a correlation coefficient (R) of -0.453 and weighted average of 6.7%, a difference of 48.3%.
Family Poverty Correlation Summary
| Measurement | Immigrants from Africa | Thai |
| Minimum | 2.2% | 0.91% |
| Maximum | 42.2% | 11.5% |
| Range | 40.0% | 10.6% |
| Mean | 13.1% | 4.7% |
| Median | 10.7% | 4.3% |
| Interquartile 25% (IQ1) | 8.9% | 3.3% |
| Interquartile 75% (IQ3) | 14.2% | 5.7% |
| Interquartile Range (IQR) | 5.3% | 2.4% |
| Standard Deviation (Sample) | 7.4% | 2.1% |
| Standard Deviation (Population) | 7.3% | 2.1% |
Similar Demographics by Family Poverty
Demographics Similar to Immigrants from Africa by Family Poverty
In terms of family poverty, the demographic groups most similar to Immigrants from Africa are Japanese (9.9%, a difference of 0.30%), Marshallese (9.9%, a difference of 0.30%), Immigrants from Cambodia (9.9%, a difference of 0.33%), Immigrants (10.0%, a difference of 0.55%), and Bermudan (9.9%, a difference of 0.61%).
| Demographics | Rating | Rank | Family Poverty |
| Moroccans | 6.5 /100 | #216 | Tragic 9.8% |
| Americans | 6.2 /100 | #217 | Tragic 9.8% |
| Panamanians | 5.6 /100 | #218 | Tragic 9.8% |
| Immigrants | Eritrea | 5.4 /100 | #219 | Tragic 9.9% |
| Bermudans | 5.3 /100 | #220 | Tragic 9.9% |
| Immigrants | Cambodia | 4.8 /100 | #221 | Tragic 9.9% |
| Japanese | 4.8 /100 | #222 | Tragic 9.9% |
| Immigrants | Africa | 4.3 /100 | #223 | Tragic 9.9% |
| Marshallese | 3.9 /100 | #224 | Tragic 9.9% |
| Immigrants | Immigrants | 3.6 /100 | #225 | Tragic 10.0% |
| Ottawa | 3.3 /100 | #226 | Tragic 10.0% |
| Immigrants | Armenia | 3.3 /100 | #227 | Tragic 10.0% |
| Sudanese | 3.1 /100 | #228 | Tragic 10.0% |
| Immigrants | Uzbekistan | 3.1 /100 | #229 | Tragic 10.0% |
| Immigrants | Panama | 3.1 /100 | #230 | Tragic 10.0% |
Demographics Similar to Thais by Family Poverty
In terms of family poverty, the demographic groups most similar to Thais are Filipino (6.6%, a difference of 0.57%), Immigrants from Taiwan (6.6%, a difference of 1.2%), Chinese (6.5%, a difference of 2.8%), Norwegian (6.9%, a difference of 3.0%), and Immigrants from Ireland (7.0%, a difference of 4.4%).
| Demographics | Rating | Rank | Family Poverty |
| Immigrants | India | 100.0 /100 | #1 | Exceptional 6.2% |
| Chinese | 100.0 /100 | #2 | Exceptional 6.5% |
| Immigrants | Taiwan | 100.0 /100 | #3 | Exceptional 6.6% |
| Filipinos | 100.0 /100 | #4 | Exceptional 6.6% |
| Thais | 100.0 /100 | #5 | Exceptional 6.7% |
| Norwegians | 99.9 /100 | #6 | Exceptional 6.9% |
| Immigrants | Ireland | 99.9 /100 | #7 | Exceptional 7.0% |
| Bhutanese | 99.9 /100 | #8 | Exceptional 7.0% |
| Latvians | 99.9 /100 | #9 | Exceptional 7.1% |
| Bulgarians | 99.8 /100 | #10 | Exceptional 7.1% |
| Immigrants | Singapore | 99.8 /100 | #11 | Exceptional 7.1% |
| Maltese | 99.8 /100 | #12 | Exceptional 7.1% |
| Swedes | 99.8 /100 | #13 | Exceptional 7.1% |
| Iranians | 99.8 /100 | #14 | Exceptional 7.1% |
| Lithuanians | 99.8 /100 | #15 | Exceptional 7.2% |