Italian vs Thai Family Poverty
COMPARE
Italian
Thai
Family Poverty
Family Poverty Comparison
Italians
Thais
7.4%
FAMILY POVERTY
99.6/ 100
METRIC RATING
30th/ 347
METRIC RANK
6.7%
FAMILY POVERTY
100.0/ 100
METRIC RATING
5th/ 347
METRIC RANK
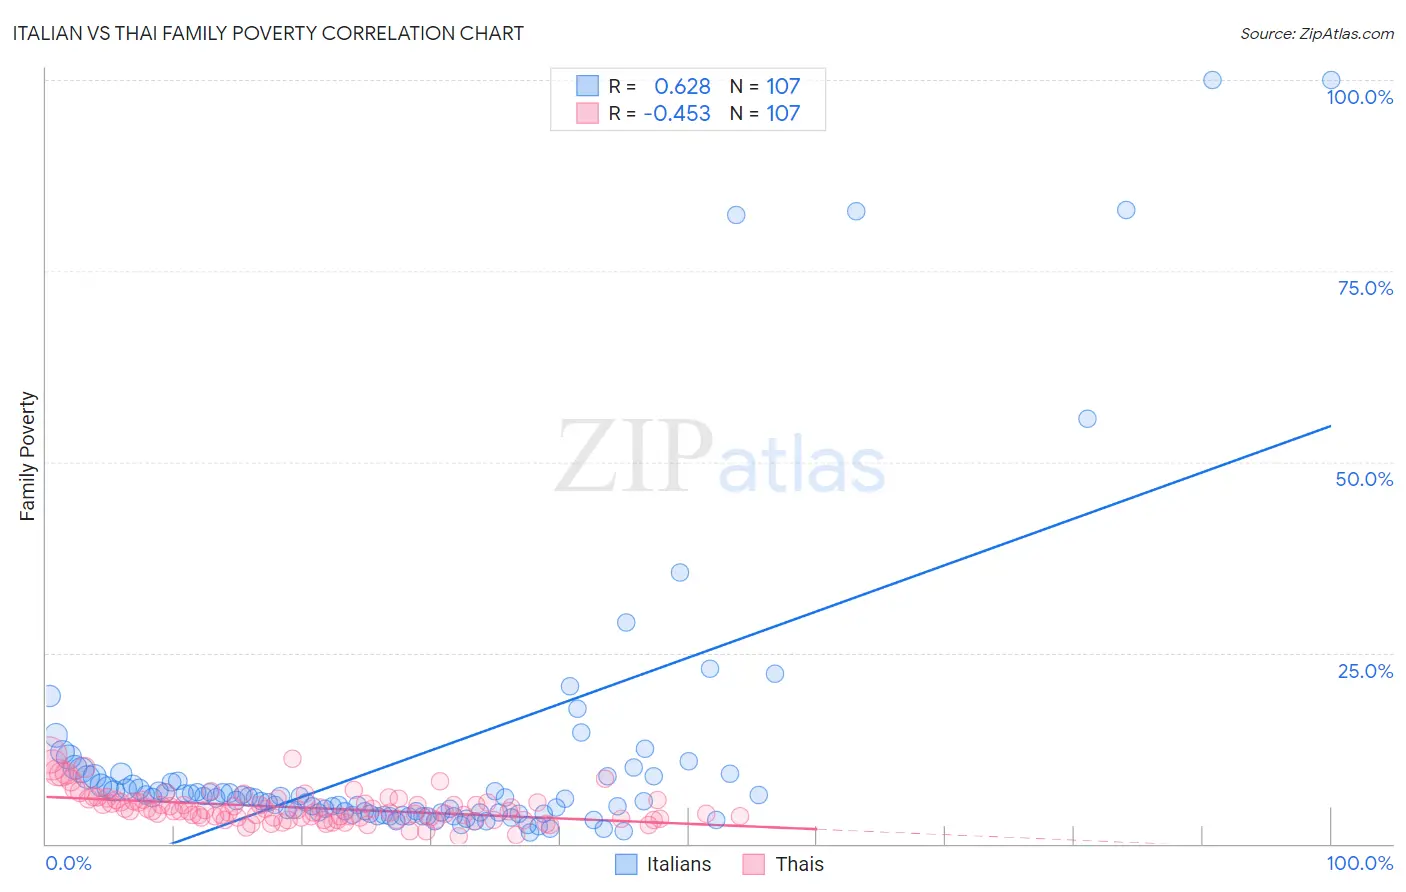
Italian vs Thai Family Poverty Correlation Chart
The statistical analysis conducted on geographies consisting of 569,861,523 people shows a significant positive correlation between the proportion of Italians and poverty level among families in the United States with a correlation coefficient (R) of 0.628 and weighted average of 7.4%. Similarly, the statistical analysis conducted on geographies consisting of 473,767,426 people shows a moderate negative correlation between the proportion of Thais and poverty level among families in the United States with a correlation coefficient (R) of -0.453 and weighted average of 6.7%, a difference of 10.7%.
Family Poverty Correlation Summary
| Measurement | Italian | Thai |
| Minimum | 1.5% | 0.91% |
| Maximum | 100.0% | 11.5% |
| Range | 98.5% | 10.6% |
| Mean | 11.4% | 4.7% |
| Median | 6.1% | 4.3% |
| Interquartile 25% (IQ1) | 4.0% | 3.3% |
| Interquartile 75% (IQ3) | 8.8% | 5.7% |
| Interquartile Range (IQR) | 4.8% | 2.4% |
| Standard Deviation (Sample) | 18.9% | 2.1% |
| Standard Deviation (Population) | 18.8% | 2.1% |
Similar Demographics by Family Poverty
Demographics Similar to Italians by Family Poverty
In terms of family poverty, the demographic groups most similar to Italians are Czech (7.4%, a difference of 0.12%), Immigrants from Northern Europe (7.4%, a difference of 0.29%), Polish (7.4%, a difference of 0.42%), Immigrants from Japan (7.4%, a difference of 0.42%), and Immigrants from Korea (7.4%, a difference of 0.46%).
| Demographics | Rating | Rank | Family Poverty |
| Assyrians/Chaldeans/Syriacs | 99.7 /100 | #23 | Exceptional 7.3% |
| Croatians | 99.7 /100 | #24 | Exceptional 7.3% |
| Burmese | 99.7 /100 | #25 | Exceptional 7.3% |
| Cypriots | 99.6 /100 | #26 | Exceptional 7.3% |
| Immigrants | Scotland | 99.6 /100 | #27 | Exceptional 7.3% |
| Immigrants | Korea | 99.6 /100 | #28 | Exceptional 7.4% |
| Immigrants | Northern Europe | 99.6 /100 | #29 | Exceptional 7.4% |
| Italians | 99.6 /100 | #30 | Exceptional 7.4% |
| Czechs | 99.6 /100 | #31 | Exceptional 7.4% |
| Poles | 99.5 /100 | #32 | Exceptional 7.4% |
| Immigrants | Japan | 99.5 /100 | #33 | Exceptional 7.4% |
| Russians | 99.5 /100 | #34 | Exceptional 7.5% |
| Greeks | 99.4 /100 | #35 | Exceptional 7.5% |
| Turks | 99.4 /100 | #36 | Exceptional 7.5% |
| Estonians | 99.4 /100 | #37 | Exceptional 7.5% |
Demographics Similar to Thais by Family Poverty
In terms of family poverty, the demographic groups most similar to Thais are Filipino (6.6%, a difference of 0.57%), Immigrants from Taiwan (6.6%, a difference of 1.2%), Chinese (6.5%, a difference of 2.8%), Norwegian (6.9%, a difference of 3.0%), and Immigrants from Ireland (7.0%, a difference of 4.4%).
| Demographics | Rating | Rank | Family Poverty |
| Immigrants | India | 100.0 /100 | #1 | Exceptional 6.2% |
| Chinese | 100.0 /100 | #2 | Exceptional 6.5% |
| Immigrants | Taiwan | 100.0 /100 | #3 | Exceptional 6.6% |
| Filipinos | 100.0 /100 | #4 | Exceptional 6.6% |
| Thais | 100.0 /100 | #5 | Exceptional 6.7% |
| Norwegians | 99.9 /100 | #6 | Exceptional 6.9% |
| Immigrants | Ireland | 99.9 /100 | #7 | Exceptional 7.0% |
| Bhutanese | 99.9 /100 | #8 | Exceptional 7.0% |
| Latvians | 99.9 /100 | #9 | Exceptional 7.1% |
| Bulgarians | 99.8 /100 | #10 | Exceptional 7.1% |
| Immigrants | Singapore | 99.8 /100 | #11 | Exceptional 7.1% |
| Maltese | 99.8 /100 | #12 | Exceptional 7.1% |
| Swedes | 99.8 /100 | #13 | Exceptional 7.1% |
| Iranians | 99.8 /100 | #14 | Exceptional 7.1% |
| Lithuanians | 99.8 /100 | #15 | Exceptional 7.2% |