Immigrants from Zimbabwe vs Thai Family Poverty
COMPARE
Immigrants from Zimbabwe
Thai
Family Poverty
Family Poverty Comparison
Immigrants from Zimbabwe
Thais
8.2%
FAMILY POVERTY
94.0/ 100
METRIC RATING
114th/ 347
METRIC RANK
6.7%
FAMILY POVERTY
100.0/ 100
METRIC RATING
5th/ 347
METRIC RANK
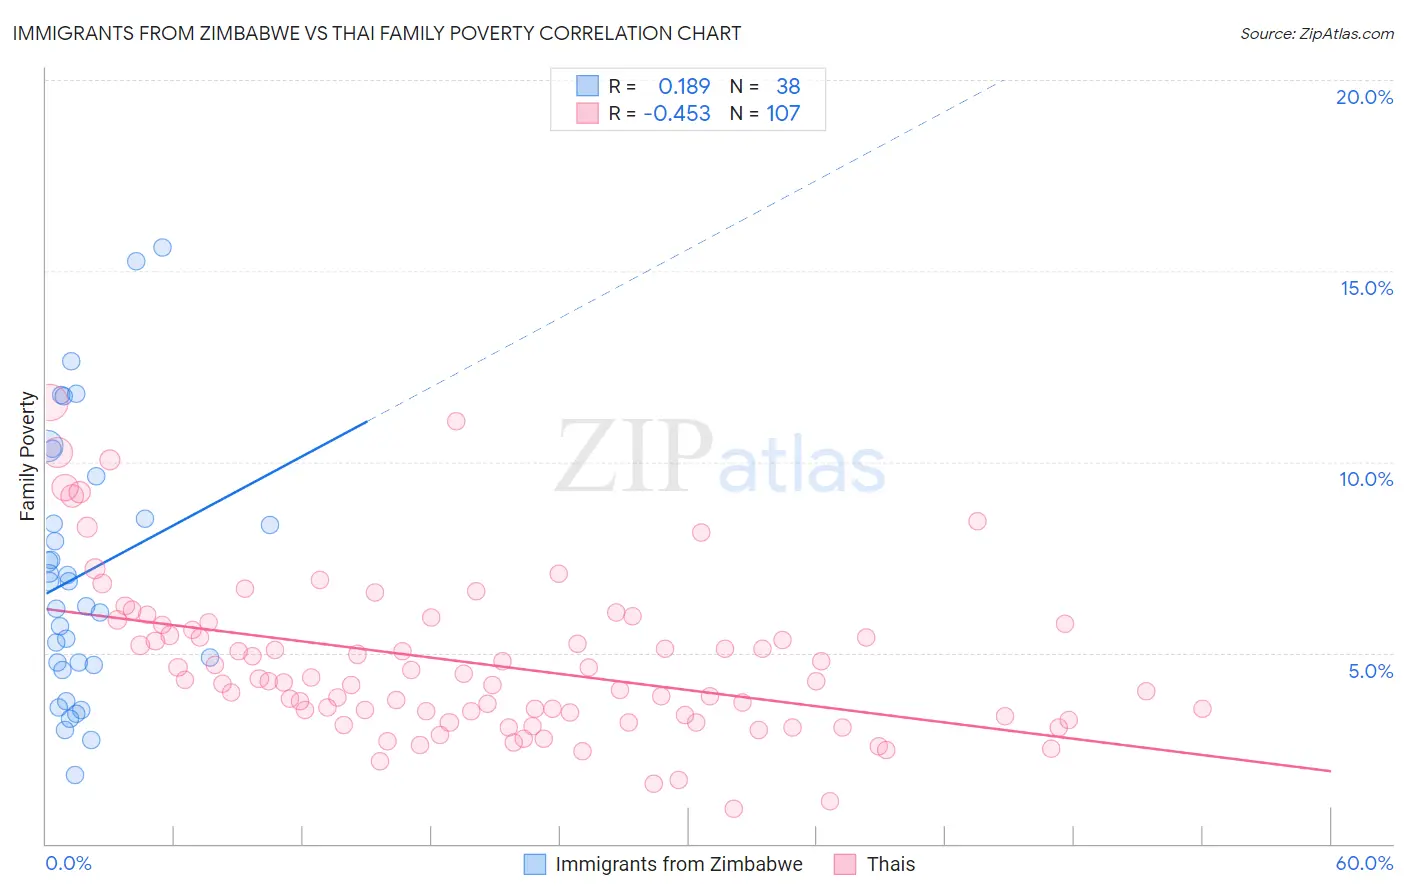
Immigrants from Zimbabwe vs Thai Family Poverty Correlation Chart
The statistical analysis conducted on geographies consisting of 117,739,253 people shows a poor positive correlation between the proportion of Immigrants from Zimbabwe and poverty level among families in the United States with a correlation coefficient (R) of 0.189 and weighted average of 8.2%. Similarly, the statistical analysis conducted on geographies consisting of 473,767,426 people shows a moderate negative correlation between the proportion of Thais and poverty level among families in the United States with a correlation coefficient (R) of -0.453 and weighted average of 6.7%, a difference of 22.5%.
Family Poverty Correlation Summary
| Measurement | Immigrants from Zimbabwe | Thai |
| Minimum | 1.8% | 0.91% |
| Maximum | 15.6% | 11.5% |
| Range | 13.8% | 10.6% |
| Mean | 7.1% | 4.7% |
| Median | 6.5% | 4.3% |
| Interquartile 25% (IQ1) | 4.7% | 3.3% |
| Interquartile 75% (IQ3) | 8.5% | 5.7% |
| Interquartile Range (IQR) | 3.8% | 2.4% |
| Standard Deviation (Sample) | 3.4% | 2.1% |
| Standard Deviation (Population) | 3.4% | 2.1% |
Similar Demographics by Family Poverty
Demographics Similar to Immigrants from Zimbabwe by Family Poverty
In terms of family poverty, the demographic groups most similar to Immigrants from Zimbabwe are Canadian (8.2%, a difference of 0.090%), Immigrants from France (8.2%, a difference of 0.26%), Immigrants from Israel (8.2%, a difference of 0.34%), Taiwanese (8.2%, a difference of 0.37%), and South African (8.2%, a difference of 0.41%).
| Demographics | Rating | Rank | Family Poverty |
| French Canadians | 95.0 /100 | #107 | Exceptional 8.1% |
| Basques | 94.9 /100 | #108 | Exceptional 8.1% |
| Jordanians | 94.8 /100 | #109 | Exceptional 8.2% |
| Romanians | 94.7 /100 | #110 | Exceptional 8.2% |
| Taiwanese | 94.6 /100 | #111 | Exceptional 8.2% |
| Immigrants | France | 94.4 /100 | #112 | Exceptional 8.2% |
| Canadians | 94.2 /100 | #113 | Exceptional 8.2% |
| Immigrants | Zimbabwe | 94.0 /100 | #114 | Exceptional 8.2% |
| Immigrants | Israel | 93.5 /100 | #115 | Exceptional 8.2% |
| South Africans | 93.4 /100 | #116 | Exceptional 8.2% |
| Immigrants | Russia | 93.2 /100 | #117 | Exceptional 8.2% |
| Immigrants | Western Europe | 92.9 /100 | #118 | Exceptional 8.2% |
| French | 92.8 /100 | #119 | Exceptional 8.3% |
| Immigrants | Egypt | 91.6 /100 | #120 | Exceptional 8.3% |
| Native Hawaiians | 91.3 /100 | #121 | Exceptional 8.3% |
Demographics Similar to Thais by Family Poverty
In terms of family poverty, the demographic groups most similar to Thais are Filipino (6.6%, a difference of 0.57%), Immigrants from Taiwan (6.6%, a difference of 1.2%), Chinese (6.5%, a difference of 2.8%), Norwegian (6.9%, a difference of 3.0%), and Immigrants from Ireland (7.0%, a difference of 4.4%).
| Demographics | Rating | Rank | Family Poverty |
| Immigrants | India | 100.0 /100 | #1 | Exceptional 6.2% |
| Chinese | 100.0 /100 | #2 | Exceptional 6.5% |
| Immigrants | Taiwan | 100.0 /100 | #3 | Exceptional 6.6% |
| Filipinos | 100.0 /100 | #4 | Exceptional 6.6% |
| Thais | 100.0 /100 | #5 | Exceptional 6.7% |
| Norwegians | 99.9 /100 | #6 | Exceptional 6.9% |
| Immigrants | Ireland | 99.9 /100 | #7 | Exceptional 7.0% |
| Bhutanese | 99.9 /100 | #8 | Exceptional 7.0% |
| Latvians | 99.9 /100 | #9 | Exceptional 7.1% |
| Bulgarians | 99.8 /100 | #10 | Exceptional 7.1% |
| Immigrants | Singapore | 99.8 /100 | #11 | Exceptional 7.1% |
| Maltese | 99.8 /100 | #12 | Exceptional 7.1% |
| Swedes | 99.8 /100 | #13 | Exceptional 7.1% |
| Iranians | 99.8 /100 | #14 | Exceptional 7.1% |
| Lithuanians | 99.8 /100 | #15 | Exceptional 7.2% |