Houma vs Scottish Unemployment
COMPARE
Houma
Scottish
Unemployment
Unemployment Comparison
Houma
Scottish
6.7%
UNEMPLOYMENT
0.0/ 100
METRIC RATING
315th/ 347
METRIC RANK
4.7%
UNEMPLOYMENT
99.9/ 100
METRIC RATING
19th/ 347
METRIC RANK
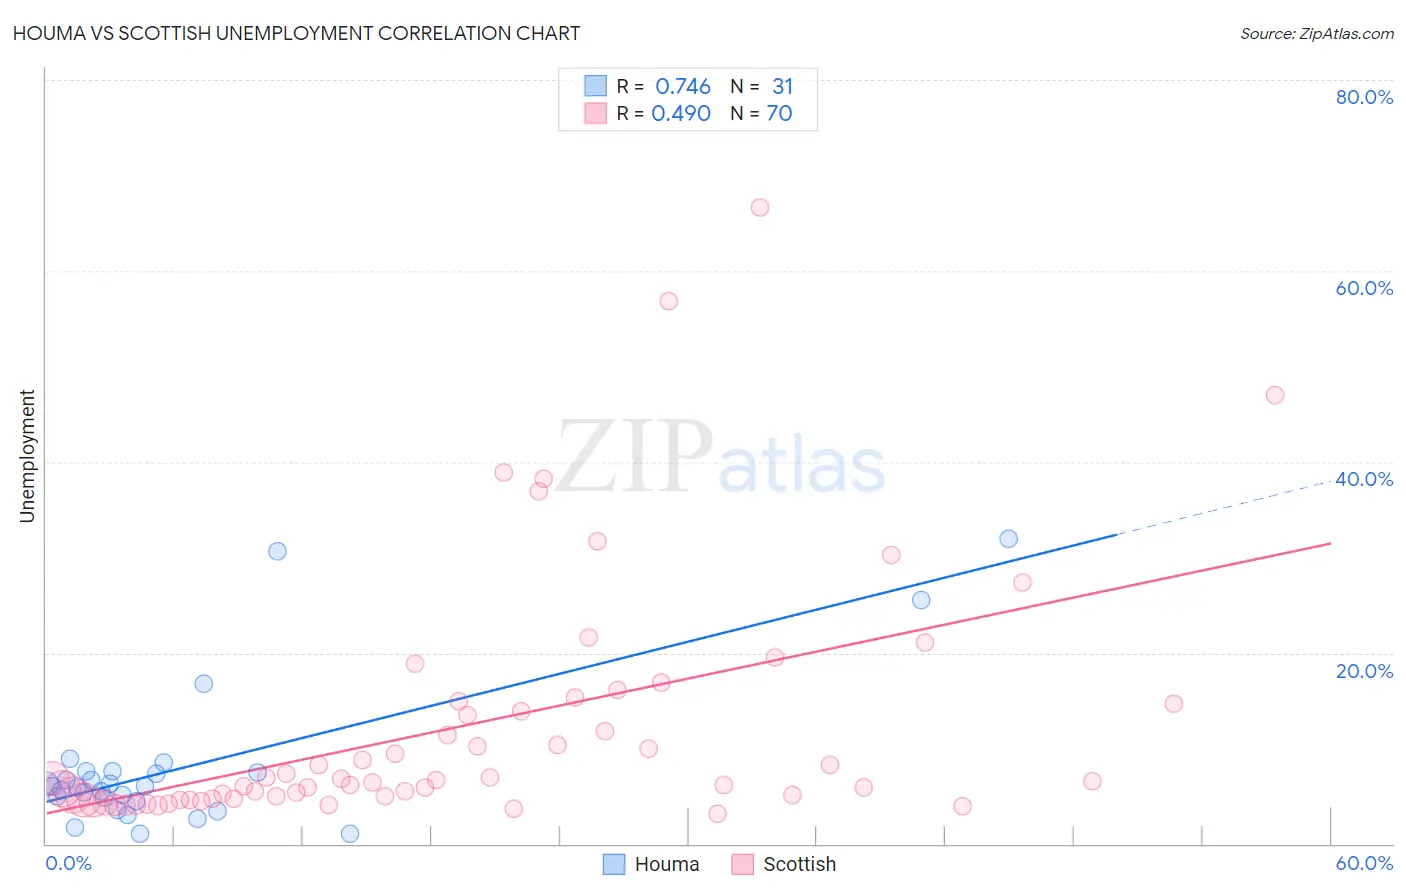
Houma vs Scottish Unemployment Correlation Chart
The statistical analysis conducted on geographies consisting of 36,775,803 people shows a strong positive correlation between the proportion of Houma and unemployment in the United States with a correlation coefficient (R) of 0.746 and weighted average of 6.7%. Similarly, the statistical analysis conducted on geographies consisting of 563,082,415 people shows a moderate positive correlation between the proportion of Scottish and unemployment in the United States with a correlation coefficient (R) of 0.490 and weighted average of 4.7%, a difference of 43.4%.
Unemployment Correlation Summary
| Measurement | Houma | Scottish |
| Minimum | 1.0% | 3.2% |
| Maximum | 32.0% | 66.7% |
| Range | 31.0% | 63.5% |
| Mean | 8.0% | 12.3% |
| Median | 6.0% | 6.6% |
| Interquartile 25% (IQ1) | 4.5% | 4.8% |
| Interquartile 75% (IQ3) | 7.6% | 14.7% |
| Interquartile Range (IQR) | 3.1% | 9.9% |
| Standard Deviation (Sample) | 7.7% | 12.9% |
| Standard Deviation (Population) | 7.6% | 12.8% |
Similar Demographics by Unemployment
Demographics Similar to Houma by Unemployment
In terms of unemployment, the demographic groups most similar to Houma are Black/African American (6.6%, a difference of 0.80%), Immigrants from Dominica (6.7%, a difference of 0.83%), Immigrants from Barbados (6.6%, a difference of 1.3%), Shoshone (6.8%, a difference of 1.4%), and Colville (6.6%, a difference of 1.7%).
| Demographics | Rating | Rank | Unemployment |
| Barbadians | 0.0 /100 | #308 | Tragic 6.5% |
| Vietnamese | 0.0 /100 | #309 | Tragic 6.5% |
| Immigrants | Belize | 0.0 /100 | #310 | Tragic 6.5% |
| Cape Verdeans | 0.0 /100 | #311 | Tragic 6.5% |
| Colville | 0.0 /100 | #312 | Tragic 6.6% |
| Immigrants | Barbados | 0.0 /100 | #313 | Tragic 6.6% |
| Blacks/African Americans | 0.0 /100 | #314 | Tragic 6.6% |
| Houma | 0.0 /100 | #315 | Tragic 6.7% |
| Immigrants | Dominica | 0.0 /100 | #316 | Tragic 6.7% |
| Shoshone | 0.0 /100 | #317 | Tragic 6.8% |
| Immigrants | Cabo Verde | 0.0 /100 | #318 | Tragic 6.8% |
| British West Indians | 0.0 /100 | #319 | Tragic 6.8% |
| Immigrants | St. Vincent and the Grenadines | 0.0 /100 | #320 | Tragic 6.9% |
| Immigrants | Guyana | 0.0 /100 | #321 | Tragic 6.9% |
| Guyanese | 0.0 /100 | #322 | Tragic 6.9% |
Demographics Similar to Scottish by Unemployment
In terms of unemployment, the demographic groups most similar to Scottish are Immigrants from Venezuela (4.7%, a difference of 0.080%), Slovene (4.7%, a difference of 0.10%), Chinese (4.7%, a difference of 0.21%), European (4.6%, a difference of 0.35%), and Carpatho Rusyn (4.7%, a difference of 0.59%).
| Demographics | Rating | Rank | Unemployment |
| Pennsylvania Germans | 100.0 /100 | #12 | Exceptional 4.6% |
| Belgians | 100.0 /100 | #13 | Exceptional 4.6% |
| Immigrants | Cuba | 100.0 /100 | #14 | Exceptional 4.6% |
| Europeans | 99.9 /100 | #15 | Exceptional 4.6% |
| Chinese | 99.9 /100 | #16 | Exceptional 4.7% |
| Slovenes | 99.9 /100 | #17 | Exceptional 4.7% |
| Immigrants | Venezuela | 99.9 /100 | #18 | Exceptional 4.7% |
| Scottish | 99.9 /100 | #19 | Exceptional 4.7% |
| Carpatho Rusyns | 99.9 /100 | #20 | Exceptional 4.7% |
| Welsh | 99.9 /100 | #21 | Exceptional 4.7% |
| Thais | 99.9 /100 | #22 | Exceptional 4.7% |
| British | 99.9 /100 | #23 | Exceptional 4.7% |
| Venezuelans | 99.9 /100 | #24 | Exceptional 4.7% |
| Latvians | 99.9 /100 | #25 | Exceptional 4.7% |
| Bulgarians | 99.9 /100 | #26 | Exceptional 4.7% |