Immigrants from Ghana vs Scottish Poverty
COMPARE
Immigrants from Ghana
Scottish
Poverty
Poverty Comparison
Immigrants from Ghana
Scottish
14.2%
POVERTY
0.2/ 100
METRIC RATING
249th/ 347
METRIC RANK
11.5%
POVERTY
94.0/ 100
METRIC RATING
100th/ 347
METRIC RANK
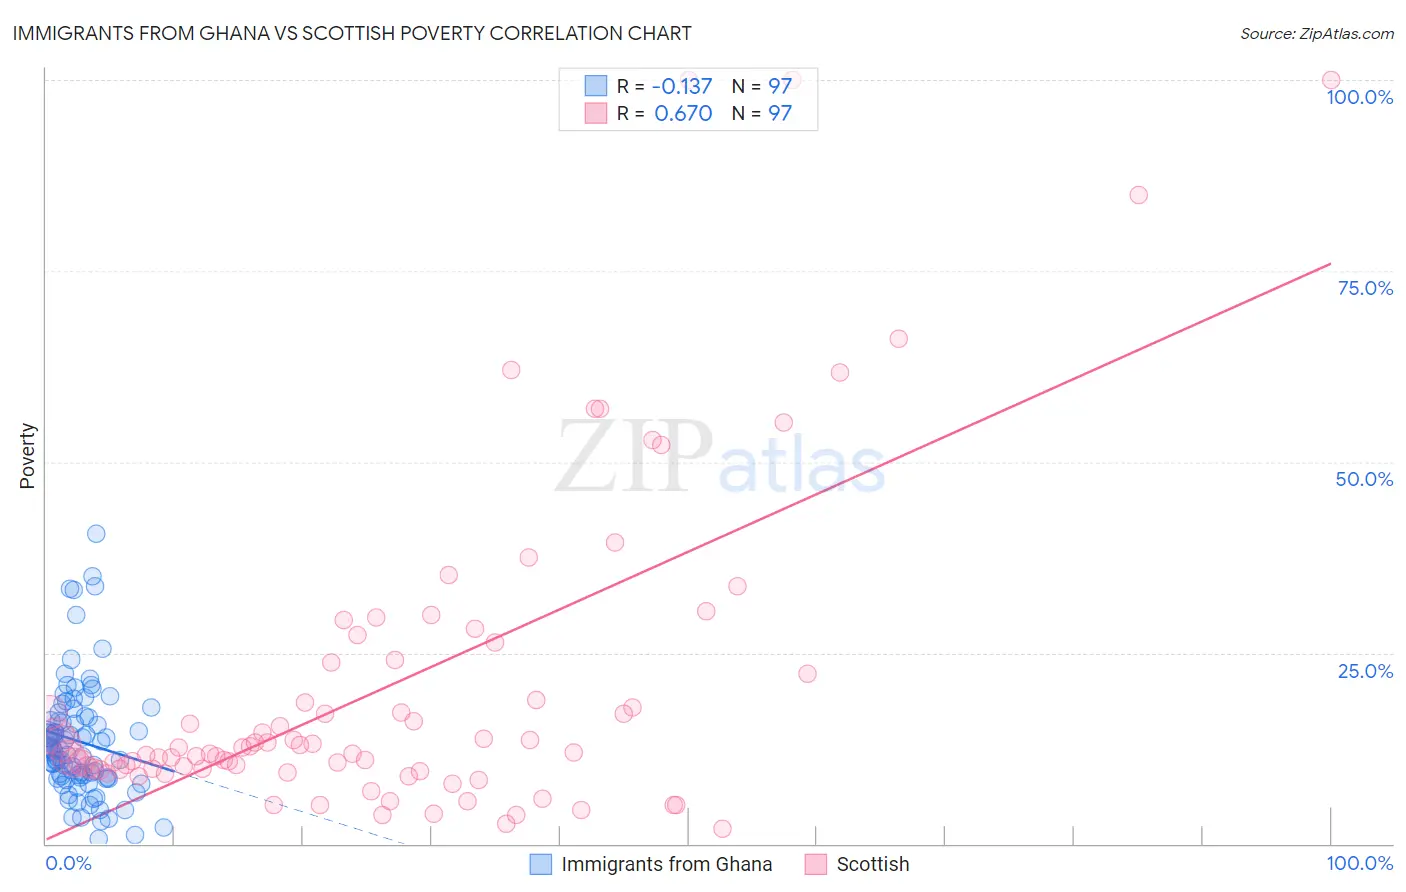
Immigrants from Ghana vs Scottish Poverty Correlation Chart
The statistical analysis conducted on geographies consisting of 199,808,032 people shows a poor negative correlation between the proportion of Immigrants from Ghana and poverty level in the United States with a correlation coefficient (R) of -0.137 and weighted average of 14.2%. Similarly, the statistical analysis conducted on geographies consisting of 566,309,495 people shows a significant positive correlation between the proportion of Scottish and poverty level in the United States with a correlation coefficient (R) of 0.670 and weighted average of 11.5%, a difference of 23.2%.
Poverty Correlation Summary
| Measurement | Immigrants from Ghana | Scottish |
| Minimum | 0.71% | 1.9% |
| Maximum | 40.5% | 100.0% |
| Range | 39.8% | 98.1% |
| Mean | 13.4% | 20.9% |
| Median | 12.2% | 12.6% |
| Interquartile 25% (IQ1) | 8.5% | 9.8% |
| Interquartile 75% (IQ3) | 16.6% | 23.9% |
| Interquartile Range (IQR) | 8.1% | 14.1% |
| Standard Deviation (Sample) | 7.6% | 21.4% |
| Standard Deviation (Population) | 7.5% | 21.3% |
Similar Demographics by Poverty
Demographics Similar to Immigrants from Ghana by Poverty
In terms of poverty, the demographic groups most similar to Immigrants from Ghana are Immigrants from Western Africa (14.1%, a difference of 0.090%), Liberian (14.1%, a difference of 0.11%), Cree (14.2%, a difference of 0.30%), Immigrants from Burma/Myanmar (14.2%, a difference of 0.39%), and Potawatomi (14.1%, a difference of 0.40%).
| Demographics | Rating | Rank | Poverty |
| Ecuadorians | 0.4 /100 | #242 | Tragic 14.0% |
| Sudanese | 0.3 /100 | #243 | Tragic 14.0% |
| Nepalese | 0.3 /100 | #244 | Tragic 14.0% |
| Immigrants | Sudan | 0.3 /100 | #245 | Tragic 14.1% |
| Potawatomi | 0.3 /100 | #246 | Tragic 14.1% |
| Liberians | 0.2 /100 | #247 | Tragic 14.1% |
| Immigrants | Western Africa | 0.2 /100 | #248 | Tragic 14.1% |
| Immigrants | Ghana | 0.2 /100 | #249 | Tragic 14.2% |
| Cree | 0.2 /100 | #250 | Tragic 14.2% |
| Immigrants | Burma/Myanmar | 0.2 /100 | #251 | Tragic 14.2% |
| Spanish American Indians | 0.2 /100 | #252 | Tragic 14.2% |
| Immigrants | Trinidad and Tobago | 0.2 /100 | #253 | Tragic 14.2% |
| Immigrants | El Salvador | 0.1 /100 | #254 | Tragic 14.3% |
| Immigrants | Ecuador | 0.1 /100 | #255 | Tragic 14.3% |
| Mexican American Indians | 0.1 /100 | #256 | Tragic 14.3% |
Demographics Similar to Scottish by Poverty
In terms of poverty, the demographic groups most similar to Scottish are Immigrants from Indonesia (11.5%, a difference of 0.11%), Immigrants from Latvia (11.5%, a difference of 0.24%), Immigrants from Egypt (11.5%, a difference of 0.28%), Immigrants from South Africa (11.5%, a difference of 0.31%), and Slavic (11.5%, a difference of 0.31%).
| Demographics | Rating | Rank | Poverty |
| Romanians | 94.9 /100 | #93 | Exceptional 11.4% |
| Paraguayans | 94.9 /100 | #94 | Exceptional 11.4% |
| Australians | 94.9 /100 | #95 | Exceptional 11.4% |
| Immigrants | South Africa | 94.7 /100 | #96 | Exceptional 11.5% |
| Immigrants | Egypt | 94.6 /100 | #97 | Exceptional 11.5% |
| Immigrants | Latvia | 94.5 /100 | #98 | Exceptional 11.5% |
| Immigrants | Indonesia | 94.2 /100 | #99 | Exceptional 11.5% |
| Scottish | 94.0 /100 | #100 | Exceptional 11.5% |
| Slavs | 93.3 /100 | #101 | Exceptional 11.5% |
| Laotians | 92.4 /100 | #102 | Exceptional 11.6% |
| Okinawans | 92.4 /100 | #103 | Exceptional 11.6% |
| Native Hawaiians | 92.1 /100 | #104 | Exceptional 11.6% |
| Portuguese | 92.1 /100 | #105 | Exceptional 11.6% |
| Immigrants | Zimbabwe | 92.1 /100 | #106 | Exceptional 11.6% |
| Palestinians | 91.8 /100 | #107 | Exceptional 11.6% |