Houma vs Scottish In Labor Force | Age 45-54
COMPARE
Houma
Scottish
In Labor Force | Age 45-54
In Labor Force | Age 45-54 Comparison
Houma
Scottish
74.1%
IN LABOR FORCE | AGE 45-54
0.0/ 100
METRIC RATING
345th/ 347
METRIC RANK
82.2%
IN LABOR FORCE | AGE 45-54
5.3/ 100
METRIC RATING
216th/ 347
METRIC RANK
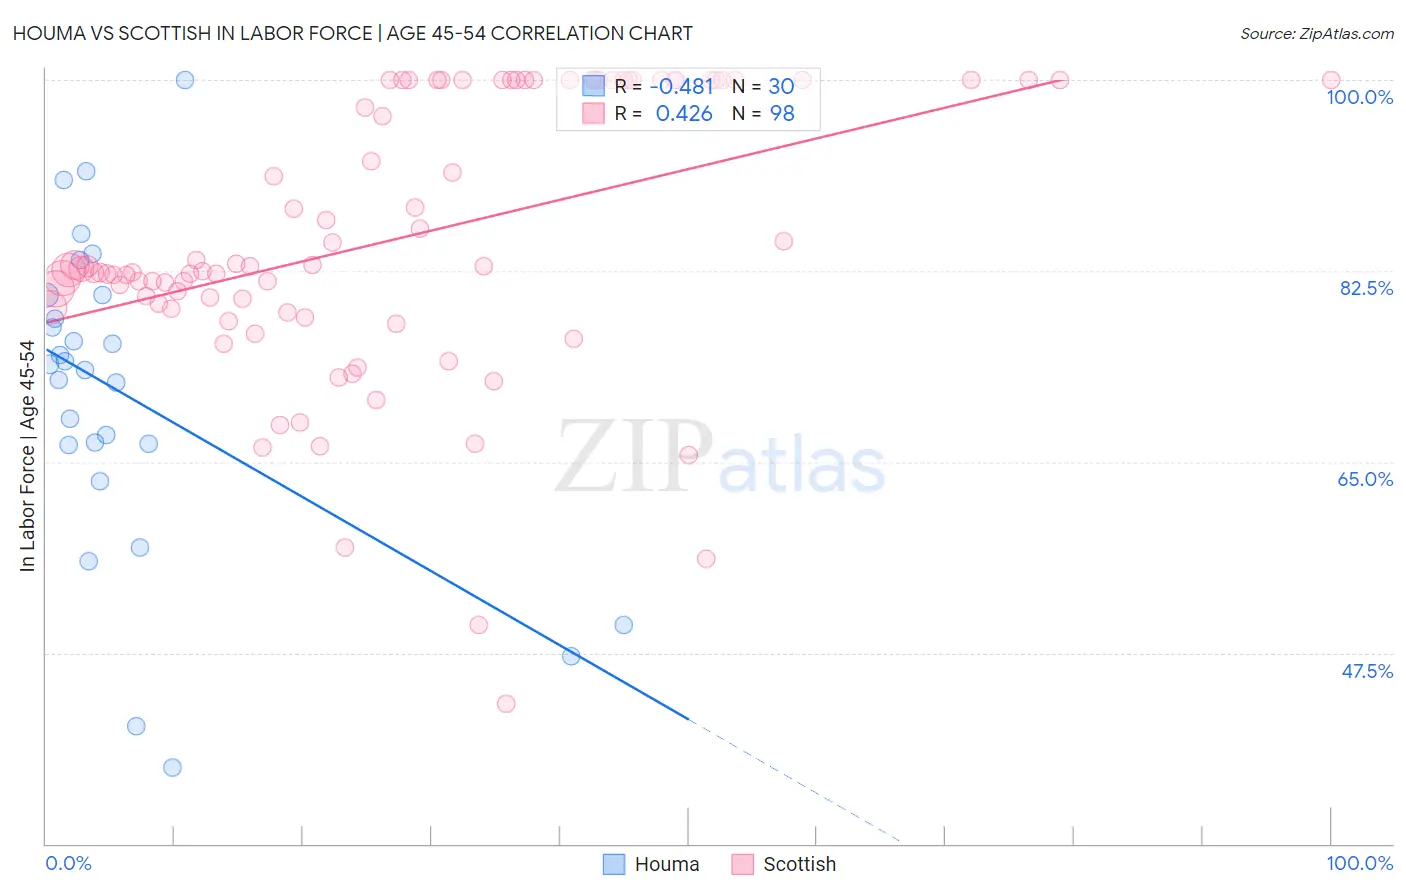
Houma vs Scottish In Labor Force | Age 45-54 Correlation Chart
The statistical analysis conducted on geographies consisting of 36,792,194 people shows a moderate negative correlation between the proportion of Houma and labor force participation rate among population between the ages 45 and 54 in the United States with a correlation coefficient (R) of -0.481 and weighted average of 74.1%. Similarly, the statistical analysis conducted on geographies consisting of 566,392,966 people shows a moderate positive correlation between the proportion of Scottish and labor force participation rate among population between the ages 45 and 54 in the United States with a correlation coefficient (R) of 0.426 and weighted average of 82.2%, a difference of 11.0%.
In Labor Force | Age 45-54 Correlation Summary
| Measurement | Houma | Scottish |
| Minimum | 37.0% | 42.8% |
| Maximum | 100.0% | 100.0% |
| Range | 63.0% | 57.2% |
| Mean | 71.1% | 85.4% |
| Median | 73.7% | 82.8% |
| Interquartile 25% (IQ1) | 66.6% | 79.1% |
| Interquartile 75% (IQ3) | 80.3% | 100.0% |
| Interquartile Range (IQR) | 13.7% | 20.9% |
| Standard Deviation (Sample) | 14.6% | 12.7% |
| Standard Deviation (Population) | 14.4% | 12.7% |
Similar Demographics by In Labor Force | Age 45-54
Demographics Similar to Houma by In Labor Force | Age 45-54
In terms of in labor force | age 45-54, the demographic groups most similar to Houma are Immigrants from Yemen (74.4%, a difference of 0.48%), Hopi (75.0%, a difference of 1.3%), Tohono O'odham (75.1%, a difference of 1.4%), Pima (72.8%, a difference of 1.7%), and Navajo (72.8%, a difference of 1.8%).
| Demographics | Rating | Rank | In Labor Force | Age 45-54 |
| Natives/Alaskans | 0.0 /100 | #333 | Tragic 77.1% |
| Apache | 0.0 /100 | #334 | Tragic 77.1% |
| Arapaho | 0.0 /100 | #335 | Tragic 77.1% |
| Paiute | 0.0 /100 | #336 | Tragic 76.7% |
| Ute | 0.0 /100 | #337 | Tragic 76.6% |
| Yuman | 0.0 /100 | #338 | Tragic 76.3% |
| Puerto Ricans | 0.0 /100 | #339 | Tragic 75.9% |
| Lumbee | 0.0 /100 | #340 | Tragic 75.6% |
| Pueblo | 0.0 /100 | #341 | Tragic 75.5% |
| Tohono O'odham | 0.0 /100 | #342 | Tragic 75.1% |
| Hopi | 0.0 /100 | #343 | Tragic 75.0% |
| Immigrants | Yemen | 0.0 /100 | #344 | Tragic 74.4% |
| Houma | 0.0 /100 | #345 | Tragic 74.1% |
| Pima | 0.0 /100 | #346 | Tragic 72.8% |
| Navajo | 0.0 /100 | #347 | Tragic 72.8% |
Demographics Similar to Scottish by In Labor Force | Age 45-54
In terms of in labor force | age 45-54, the demographic groups most similar to Scottish are Immigrants from Panama (82.2%, a difference of 0.010%), Iraqi (82.2%, a difference of 0.010%), Immigrants from Uzbekistan (82.3%, a difference of 0.020%), Portuguese (82.2%, a difference of 0.030%), and Ecuadorian (82.3%, a difference of 0.040%).
| Demographics | Rating | Rank | In Labor Force | Age 45-54 |
| Immigrants | Lebanon | 7.4 /100 | #209 | Tragic 82.3% |
| Immigrants | Bahamas | 7.1 /100 | #210 | Tragic 82.3% |
| Immigrants | Syria | 6.6 /100 | #211 | Tragic 82.3% |
| Ecuadorians | 6.3 /100 | #212 | Tragic 82.3% |
| Immigrants | Uzbekistan | 5.8 /100 | #213 | Tragic 82.3% |
| Immigrants | Panama | 5.6 /100 | #214 | Tragic 82.2% |
| Iraqis | 5.6 /100 | #215 | Tragic 82.2% |
| Scottish | 5.3 /100 | #216 | Tragic 82.2% |
| Portuguese | 4.7 /100 | #217 | Tragic 82.2% |
| English | 4.4 /100 | #218 | Tragic 82.2% |
| French | 4.1 /100 | #219 | Tragic 82.2% |
| Bahamians | 3.6 /100 | #220 | Tragic 82.2% |
| Panamanians | 3.5 /100 | #221 | Tragic 82.2% |
| Immigrants | Ecuador | 3.4 /100 | #222 | Tragic 82.2% |
| Immigrants | Immigrants | 3.1 /100 | #223 | Tragic 82.1% |