Aleut vs Scottish Poverty
COMPARE
Aleut
Scottish
Poverty
Poverty Comparison
Aleuts
Scottish
12.5%
POVERTY
33.2/ 100
METRIC RATING
189th/ 347
METRIC RANK
11.5%
POVERTY
94.0/ 100
METRIC RATING
100th/ 347
METRIC RANK
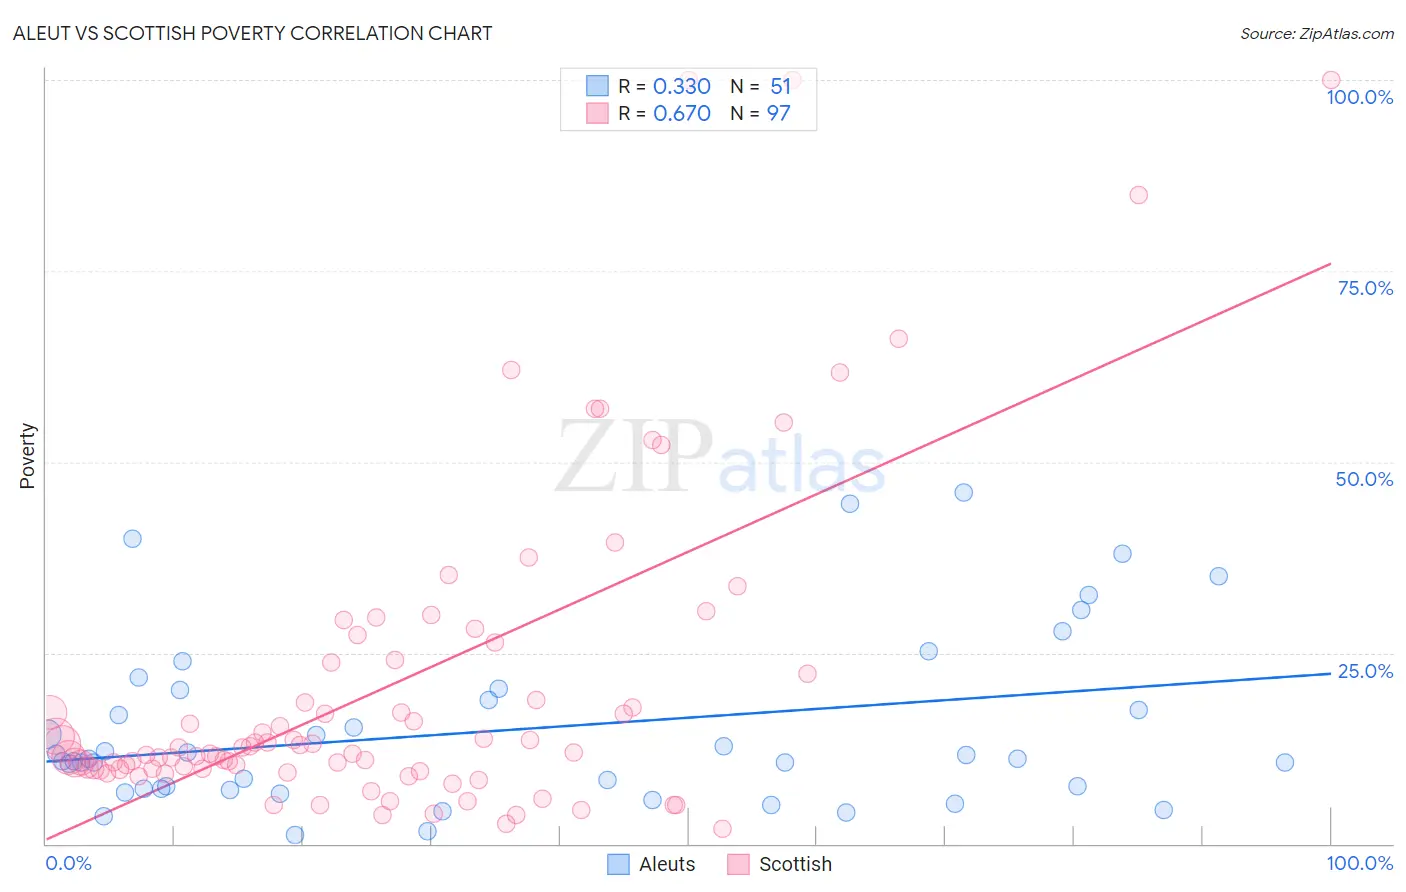
Aleut vs Scottish Poverty Correlation Chart
The statistical analysis conducted on geographies consisting of 61,776,173 people shows a mild positive correlation between the proportion of Aleuts and poverty level in the United States with a correlation coefficient (R) of 0.330 and weighted average of 12.5%. Similarly, the statistical analysis conducted on geographies consisting of 566,309,495 people shows a significant positive correlation between the proportion of Scottish and poverty level in the United States with a correlation coefficient (R) of 0.670 and weighted average of 11.5%, a difference of 9.0%.
Poverty Correlation Summary
| Measurement | Aleut | Scottish |
| Minimum | 1.1% | 1.9% |
| Maximum | 46.0% | 100.0% |
| Range | 44.9% | 98.1% |
| Mean | 14.9% | 20.9% |
| Median | 11.1% | 12.6% |
| Interquartile 25% (IQ1) | 7.2% | 9.8% |
| Interquartile 75% (IQ3) | 20.2% | 23.9% |
| Interquartile Range (IQR) | 13.0% | 14.1% |
| Standard Deviation (Sample) | 11.2% | 21.4% |
| Standard Deviation (Population) | 11.1% | 21.3% |
Similar Demographics by Poverty
Demographics Similar to Aleuts by Poverty
In terms of poverty, the demographic groups most similar to Aleuts are Immigrants from Costa Rica (12.5%, a difference of 0.010%), Hawaiian (12.5%, a difference of 0.090%), Immigrants from South America (12.5%, a difference of 0.090%), Sierra Leonean (12.6%, a difference of 0.19%), and Immigrants from Sierra Leone (12.5%, a difference of 0.32%).
| Demographics | Rating | Rank | Poverty |
| Immigrants | Cameroon | 41.7 /100 | #182 | Average 12.4% |
| Immigrants | Iraq | 40.2 /100 | #183 | Average 12.4% |
| Kenyans | 38.8 /100 | #184 | Fair 12.5% |
| Israelis | 36.4 /100 | #185 | Fair 12.5% |
| Immigrants | Sierra Leone | 36.3 /100 | #186 | Fair 12.5% |
| Hawaiians | 34.1 /100 | #187 | Fair 12.5% |
| Immigrants | Costa Rica | 33.3 /100 | #188 | Fair 12.5% |
| Aleuts | 33.2 /100 | #189 | Fair 12.5% |
| Immigrants | South America | 32.3 /100 | #190 | Fair 12.5% |
| Sierra Leoneans | 31.5 /100 | #191 | Fair 12.6% |
| South American Indians | 23.3 /100 | #192 | Fair 12.7% |
| Delaware | 21.4 /100 | #193 | Fair 12.7% |
| Arabs | 21.1 /100 | #194 | Fair 12.7% |
| Immigrants | Kuwait | 20.9 /100 | #195 | Fair 12.7% |
| Iraqis | 20.8 /100 | #196 | Fair 12.7% |
Demographics Similar to Scottish by Poverty
In terms of poverty, the demographic groups most similar to Scottish are Immigrants from Indonesia (11.5%, a difference of 0.11%), Immigrants from Latvia (11.5%, a difference of 0.24%), Immigrants from Egypt (11.5%, a difference of 0.28%), Immigrants from South Africa (11.5%, a difference of 0.31%), and Slavic (11.5%, a difference of 0.31%).
| Demographics | Rating | Rank | Poverty |
| Romanians | 94.9 /100 | #93 | Exceptional 11.4% |
| Paraguayans | 94.9 /100 | #94 | Exceptional 11.4% |
| Australians | 94.9 /100 | #95 | Exceptional 11.4% |
| Immigrants | South Africa | 94.7 /100 | #96 | Exceptional 11.5% |
| Immigrants | Egypt | 94.6 /100 | #97 | Exceptional 11.5% |
| Immigrants | Latvia | 94.5 /100 | #98 | Exceptional 11.5% |
| Immigrants | Indonesia | 94.2 /100 | #99 | Exceptional 11.5% |
| Scottish | 94.0 /100 | #100 | Exceptional 11.5% |
| Slavs | 93.3 /100 | #101 | Exceptional 11.5% |
| Laotians | 92.4 /100 | #102 | Exceptional 11.6% |
| Okinawans | 92.4 /100 | #103 | Exceptional 11.6% |
| Native Hawaiians | 92.1 /100 | #104 | Exceptional 11.6% |
| Portuguese | 92.1 /100 | #105 | Exceptional 11.6% |
| Immigrants | Zimbabwe | 92.1 /100 | #106 | Exceptional 11.6% |
| Palestinians | 91.8 /100 | #107 | Exceptional 11.6% |