Houma vs Scottish Professional Degree
COMPARE
Houma
Scottish
Professional Degree
Professional Degree Comparison
Houma
Scottish
2.2%
PROFESSIONAL DEGREE
0.0/ 100
METRIC RATING
347th/ 347
METRIC RANK
4.6%
PROFESSIONAL DEGREE
71.8/ 100
METRIC RATING
154th/ 347
METRIC RANK
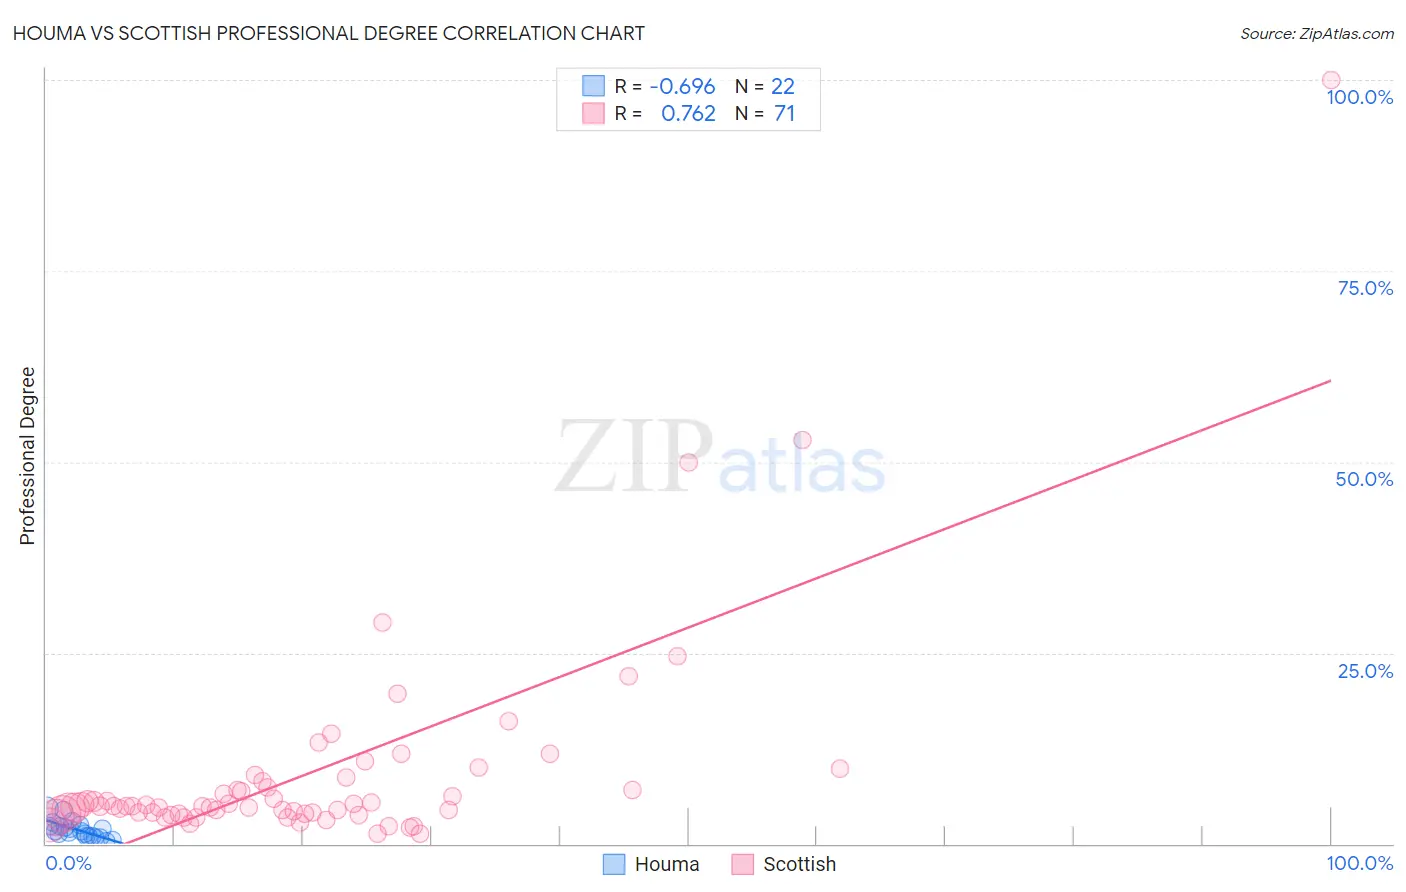
Houma vs Scottish Professional Degree Correlation Chart
The statistical analysis conducted on geographies consisting of 36,689,629 people shows a significant negative correlation between the proportion of Houma and percentage of population with at least professional degree education in the United States with a correlation coefficient (R) of -0.696 and weighted average of 2.2%. Similarly, the statistical analysis conducted on geographies consisting of 558,904,242 people shows a strong positive correlation between the proportion of Scottish and percentage of population with at least professional degree education in the United States with a correlation coefficient (R) of 0.762 and weighted average of 4.6%, a difference of 105.6%.
Professional Degree Correlation Summary
| Measurement | Houma | Scottish |
| Minimum | 0.35% | 1.3% |
| Maximum | 4.6% | 100.0% |
| Range | 4.3% | 98.7% |
| Mean | 1.9% | 9.2% |
| Median | 1.7% | 4.9% |
| Interquartile 25% (IQ1) | 1.0% | 4.0% |
| Interquartile 75% (IQ3) | 2.4% | 8.2% |
| Interquartile Range (IQR) | 1.4% | 4.2% |
| Standard Deviation (Sample) | 1.1% | 14.2% |
| Standard Deviation (Population) | 1.1% | 14.1% |
Similar Demographics by Professional Degree
Demographics Similar to Houma by Professional Degree
In terms of professional degree, the demographic groups most similar to Houma are Lumbee (2.5%, a difference of 11.1%), Immigrants from Mexico (2.6%, a difference of 19.3%), Spanish American Indian (2.7%, a difference of 19.7%), Mexican (2.7%, a difference of 24.0%), and Immigrants from the Azores (2.8%, a difference of 27.6%).
| Demographics | Rating | Rank | Professional Degree |
| Puget Sound Salish | 0.0 /100 | #333 | Tragic 3.1% |
| Pennsylvania Germans | 0.0 /100 | #334 | Tragic 3.0% |
| Natives/Alaskans | 0.0 /100 | #335 | Tragic 3.0% |
| Fijians | 0.0 /100 | #336 | Tragic 2.9% |
| Arapaho | 0.0 /100 | #337 | Tragic 2.9% |
| Navajo | 0.0 /100 | #338 | Tragic 2.9% |
| Immigrants | Central America | 0.0 /100 | #339 | Tragic 2.9% |
| Yup'ik | 0.0 /100 | #340 | Tragic 2.9% |
| Tohono O'odham | 0.0 /100 | #341 | Tragic 2.8% |
| Immigrants | Azores | 0.0 /100 | #342 | Tragic 2.8% |
| Mexicans | 0.0 /100 | #343 | Tragic 2.7% |
| Spanish American Indians | 0.0 /100 | #344 | Tragic 2.7% |
| Immigrants | Mexico | 0.0 /100 | #345 | Tragic 2.6% |
| Lumbee | 0.0 /100 | #346 | Tragic 2.5% |
| Houma | 0.0 /100 | #347 | Tragic 2.2% |
Demographics Similar to Scottish by Professional Degree
In terms of professional degree, the demographic groups most similar to Scottish are Immigrants from Africa (4.6%, a difference of 0.12%), Immigrants from Uruguay (4.6%, a difference of 0.12%), Polish (4.6%, a difference of 0.14%), Slavic (4.5%, a difference of 0.18%), and Immigrants from Oceania (4.6%, a difference of 0.28%).
| Demographics | Rating | Rank | Professional Degree |
| Colombians | 77.7 /100 | #147 | Good 4.6% |
| Slovenes | 76.1 /100 | #148 | Good 4.6% |
| Senegalese | 75.3 /100 | #149 | Good 4.6% |
| Immigrants | Oceania | 73.4 /100 | #150 | Good 4.6% |
| Poles | 72.6 /100 | #151 | Good 4.6% |
| Immigrants | Africa | 72.5 /100 | #152 | Good 4.6% |
| Immigrants | Uruguay | 72.5 /100 | #153 | Good 4.6% |
| Scottish | 71.8 /100 | #154 | Good 4.6% |
| Slavs | 70.8 /100 | #155 | Good 4.5% |
| Swedes | 69.9 /100 | #156 | Good 4.5% |
| Iraqis | 69.8 /100 | #157 | Good 4.5% |
| Immigrants | Armenia | 68.8 /100 | #158 | Good 4.5% |
| Vietnamese | 68.4 /100 | #159 | Good 4.5% |
| Immigrants | Senegal | 68.0 /100 | #160 | Good 4.5% |
| Assyrians/Chaldeans/Syriacs | 67.4 /100 | #161 | Good 4.5% |