Hawaiian vs Alsatian Single Female Poverty
COMPARE
Hawaiian
Alsatian
Single Female Poverty
Single Female Poverty Comparison
Hawaiians
Alsatians
21.2%
SINGLE FEMALE POVERTY
37.7/ 100
METRIC RATING
186th/ 347
METRIC RANK
24.5%
SINGLE FEMALE POVERTY
0.0/ 100
METRIC RATING
292nd/ 347
METRIC RANK
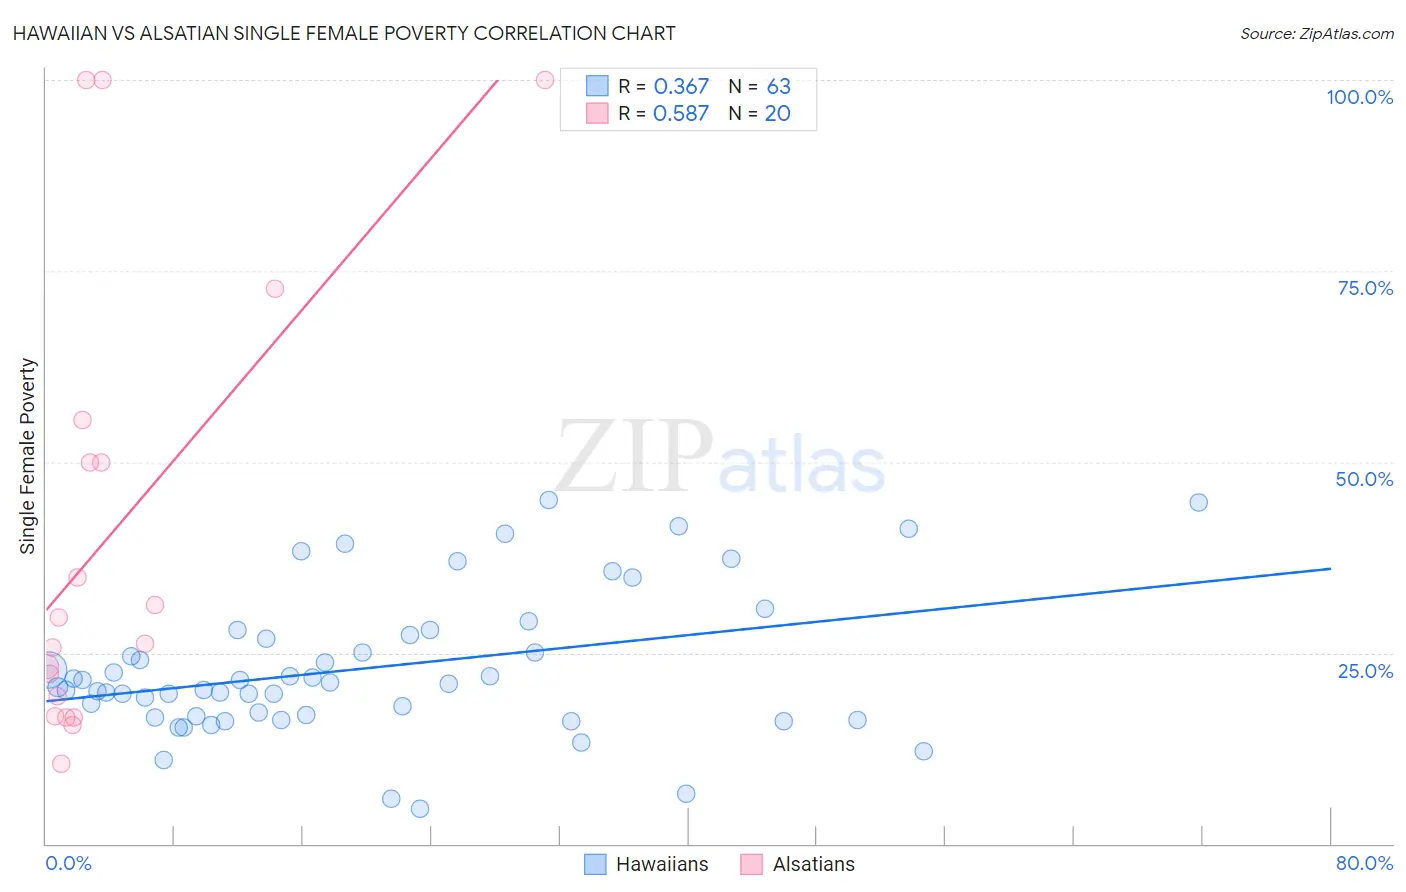
Hawaiian vs Alsatian Single Female Poverty Correlation Chart
The statistical analysis conducted on geographies consisting of 324,430,861 people shows a mild positive correlation between the proportion of Hawaiians and poverty level among single females in the United States with a correlation coefficient (R) of 0.367 and weighted average of 21.2%. Similarly, the statistical analysis conducted on geographies consisting of 82,305,024 people shows a substantial positive correlation between the proportion of Alsatians and poverty level among single females in the United States with a correlation coefficient (R) of 0.587 and weighted average of 24.5%, a difference of 15.7%.
Single Female Poverty Correlation Summary
| Measurement | Hawaiian | Alsatian |
| Minimum | 4.5% | 10.5% |
| Maximum | 45.0% | 100.0% |
| Range | 40.5% | 89.5% |
| Mean | 23.0% | 40.8% |
| Median | 20.9% | 27.9% |
| Interquartile 25% (IQ1) | 16.7% | 18.1% |
| Interquartile 75% (IQ3) | 27.3% | 52.7% |
| Interquartile Range (IQR) | 10.5% | 34.6% |
| Standard Deviation (Sample) | 9.3% | 30.0% |
| Standard Deviation (Population) | 9.2% | 29.2% |
Similar Demographics by Single Female Poverty
Demographics Similar to Hawaiians by Single Female Poverty
In terms of single female poverty, the demographic groups most similar to Hawaiians are Immigrants from Cambodia (21.2%, a difference of 0.040%), Immigrants from Nigeria (21.2%, a difference of 0.060%), Hungarian (21.1%, a difference of 0.13%), Slovak (21.1%, a difference of 0.14%), and Yugoslavian (21.2%, a difference of 0.15%).
| Demographics | Rating | Rank | Single Female Poverty |
| British | 42.9 /100 | #179 | Average 21.1% |
| Spanish American Indians | 42.5 /100 | #180 | Average 21.1% |
| Europeans | 42.3 /100 | #181 | Average 21.1% |
| Slavs | 40.5 /100 | #182 | Average 21.1% |
| Slovaks | 39.7 /100 | #183 | Fair 21.1% |
| Hungarians | 39.6 /100 | #184 | Fair 21.1% |
| Immigrants | Cambodia | 38.2 /100 | #185 | Fair 21.2% |
| Hawaiians | 37.7 /100 | #186 | Fair 21.2% |
| Immigrants | Nigeria | 36.8 /100 | #187 | Fair 21.2% |
| Yugoslavians | 35.4 /100 | #188 | Fair 21.2% |
| Immigrants | Cuba | 35.3 /100 | #189 | Fair 21.2% |
| Trinidadians and Tobagonians | 35.2 /100 | #190 | Fair 21.2% |
| Immigrants | Germany | 31.1 /100 | #191 | Fair 21.3% |
| Immigrants | Jamaica | 30.5 /100 | #192 | Fair 21.3% |
| Basques | 28.1 /100 | #193 | Fair 21.3% |
Demographics Similar to Alsatians by Single Female Poverty
In terms of single female poverty, the demographic groups most similar to Alsatians are American (24.5%, a difference of 0.080%), French American Indian (24.6%, a difference of 0.23%), Osage (24.4%, a difference of 0.37%), Hispanic or Latino (24.6%, a difference of 0.57%), and Indonesian (24.3%, a difference of 0.97%).
| Demographics | Rating | Rank | Single Female Poverty |
| Immigrants | Guatemala | 0.0 /100 | #285 | Tragic 24.1% |
| Cree | 0.0 /100 | #286 | Tragic 24.1% |
| Bangladeshis | 0.0 /100 | #287 | Tragic 24.2% |
| Spanish Americans | 0.0 /100 | #288 | Tragic 24.2% |
| U.S. Virgin Islanders | 0.0 /100 | #289 | Tragic 24.2% |
| Indonesians | 0.0 /100 | #290 | Tragic 24.3% |
| Osage | 0.0 /100 | #291 | Tragic 24.4% |
| Alsatians | 0.0 /100 | #292 | Tragic 24.5% |
| Americans | 0.0 /100 | #293 | Tragic 24.5% |
| French American Indians | 0.0 /100 | #294 | Tragic 24.6% |
| Hispanics or Latinos | 0.0 /100 | #295 | Tragic 24.6% |
| Africans | 0.0 /100 | #296 | Tragic 24.8% |
| Immigrants | Central America | 0.0 /100 | #297 | Tragic 24.8% |
| Yaqui | 0.0 /100 | #298 | Tragic 24.9% |
| Mexicans | 0.0 /100 | #299 | Tragic 25.0% |