Hawaiian vs Immigrants from Italy Single Female Poverty
COMPARE
Hawaiian
Immigrants from Italy
Single Female Poverty
Single Female Poverty Comparison
Hawaiians
Immigrants from Italy
21.2%
SINGLE FEMALE POVERTY
37.7/ 100
METRIC RATING
186th/ 347
METRIC RANK
19.0%
SINGLE FEMALE POVERTY
99.8/ 100
METRIC RATING
51st/ 347
METRIC RANK
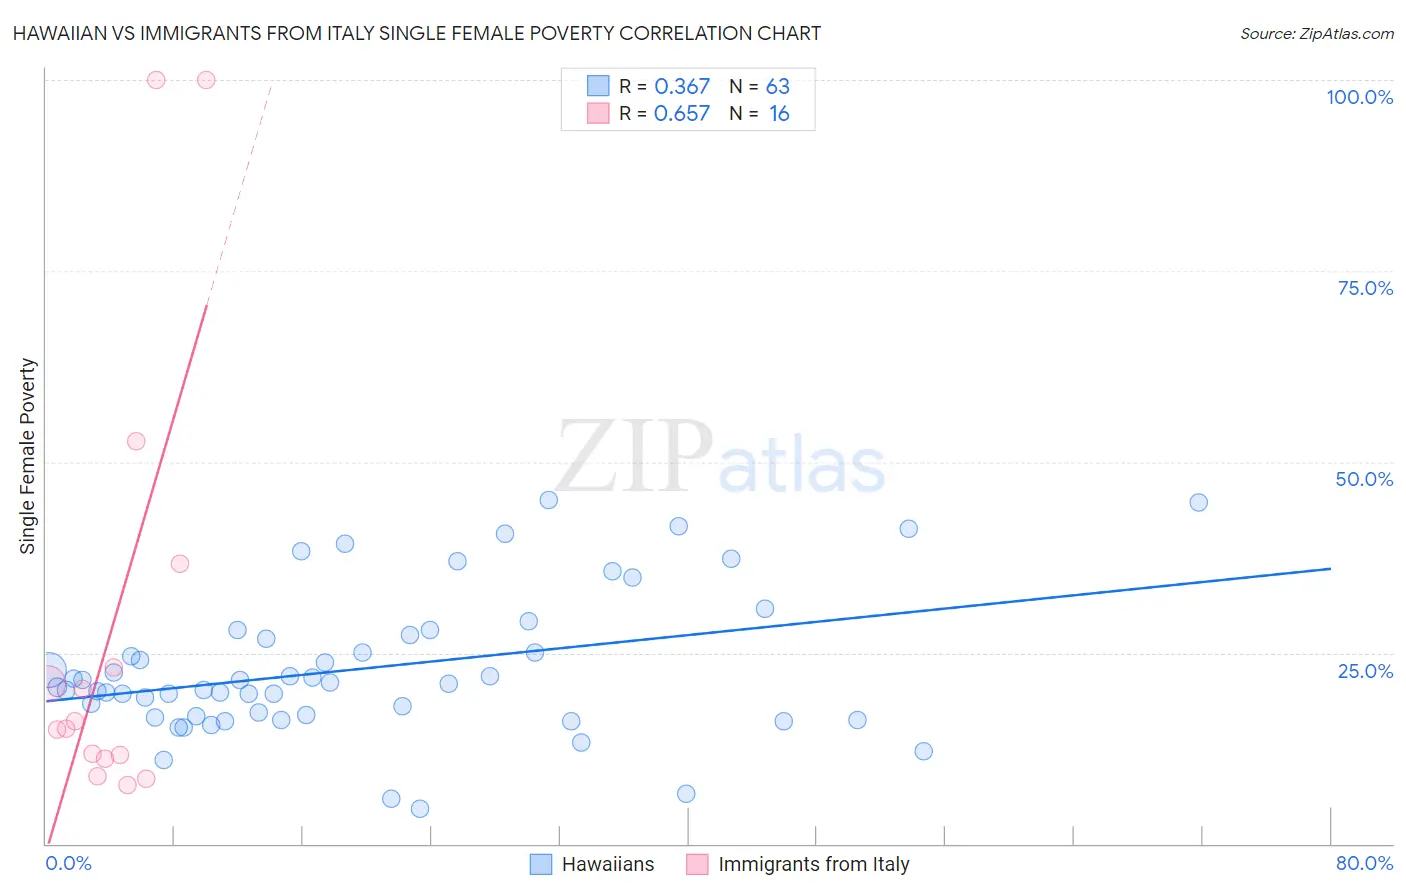
Hawaiian vs Immigrants from Italy Single Female Poverty Correlation Chart
The statistical analysis conducted on geographies consisting of 324,430,861 people shows a mild positive correlation between the proportion of Hawaiians and poverty level among single females in the United States with a correlation coefficient (R) of 0.367 and weighted average of 21.2%. Similarly, the statistical analysis conducted on geographies consisting of 318,580,979 people shows a significant positive correlation between the proportion of Immigrants from Italy and poverty level among single females in the United States with a correlation coefficient (R) of 0.657 and weighted average of 19.0%, a difference of 11.1%.
Single Female Poverty Correlation Summary
| Measurement | Hawaiian | Immigrants from Italy |
| Minimum | 4.5% | 7.7% |
| Maximum | 45.0% | 100.0% |
| Range | 40.5% | 92.3% |
| Mean | 23.0% | 28.7% |
| Median | 20.9% | 15.6% |
| Interquartile 25% (IQ1) | 16.7% | 11.4% |
| Interquartile 75% (IQ3) | 27.3% | 29.9% |
| Interquartile Range (IQR) | 10.5% | 18.5% |
| Standard Deviation (Sample) | 9.3% | 30.1% |
| Standard Deviation (Population) | 9.2% | 29.2% |
Similar Demographics by Single Female Poverty
Demographics Similar to Hawaiians by Single Female Poverty
In terms of single female poverty, the demographic groups most similar to Hawaiians are Immigrants from Cambodia (21.2%, a difference of 0.040%), Immigrants from Nigeria (21.2%, a difference of 0.060%), Hungarian (21.1%, a difference of 0.13%), Slovak (21.1%, a difference of 0.14%), and Yugoslavian (21.2%, a difference of 0.15%).
| Demographics | Rating | Rank | Single Female Poverty |
| British | 42.9 /100 | #179 | Average 21.1% |
| Spanish American Indians | 42.5 /100 | #180 | Average 21.1% |
| Europeans | 42.3 /100 | #181 | Average 21.1% |
| Slavs | 40.5 /100 | #182 | Average 21.1% |
| Slovaks | 39.7 /100 | #183 | Fair 21.1% |
| Hungarians | 39.6 /100 | #184 | Fair 21.1% |
| Immigrants | Cambodia | 38.2 /100 | #185 | Fair 21.2% |
| Hawaiians | 37.7 /100 | #186 | Fair 21.2% |
| Immigrants | Nigeria | 36.8 /100 | #187 | Fair 21.2% |
| Yugoslavians | 35.4 /100 | #188 | Fair 21.2% |
| Immigrants | Cuba | 35.3 /100 | #189 | Fair 21.2% |
| Trinidadians and Tobagonians | 35.2 /100 | #190 | Fair 21.2% |
| Immigrants | Germany | 31.1 /100 | #191 | Fair 21.3% |
| Immigrants | Jamaica | 30.5 /100 | #192 | Fair 21.3% |
| Basques | 28.1 /100 | #193 | Fair 21.3% |
Demographics Similar to Immigrants from Italy by Single Female Poverty
In terms of single female poverty, the demographic groups most similar to Immigrants from Italy are Immigrants from Eastern Europe (19.0%, a difference of 0.040%), Egyptian (19.1%, a difference of 0.040%), Immigrants from Czechoslovakia (19.0%, a difference of 0.080%), Immigrants from Argentina (19.0%, a difference of 0.090%), and Tsimshian (19.1%, a difference of 0.25%).
| Demographics | Rating | Rank | Single Female Poverty |
| Immigrants | Croatia | 99.9 /100 | #44 | Exceptional 18.9% |
| Immigrants | Indonesia | 99.8 /100 | #45 | Exceptional 18.9% |
| Macedonians | 99.8 /100 | #46 | Exceptional 18.9% |
| Latvians | 99.8 /100 | #47 | Exceptional 19.0% |
| Immigrants | Argentina | 99.8 /100 | #48 | Exceptional 19.0% |
| Immigrants | Czechoslovakia | 99.8 /100 | #49 | Exceptional 19.0% |
| Immigrants | Eastern Europe | 99.8 /100 | #50 | Exceptional 19.0% |
| Immigrants | Italy | 99.8 /100 | #51 | Exceptional 19.0% |
| Egyptians | 99.7 /100 | #52 | Exceptional 19.1% |
| Tsimshian | 99.7 /100 | #53 | Exceptional 19.1% |
| Argentineans | 99.7 /100 | #54 | Exceptional 19.1% |
| Immigrants | Vietnam | 99.7 /100 | #55 | Exceptional 19.1% |
| Immigrants | Fiji | 99.7 /100 | #56 | Exceptional 19.1% |
| Eastern Europeans | 99.7 /100 | #57 | Exceptional 19.1% |
| Immigrants | Bulgaria | 99.7 /100 | #58 | Exceptional 19.1% |