Nepalese vs Immigrants from Sudan Single Female Poverty
COMPARE
Nepalese
Immigrants from Sudan
Single Female Poverty
Single Female Poverty Comparison
Nepalese
Immigrants from Sudan
21.7%
SINGLE FEMALE POVERTY
9.7/ 100
METRIC RATING
218th/ 347
METRIC RANK
22.6%
SINGLE FEMALE POVERTY
0.8/ 100
METRIC RATING
255th/ 347
METRIC RANK
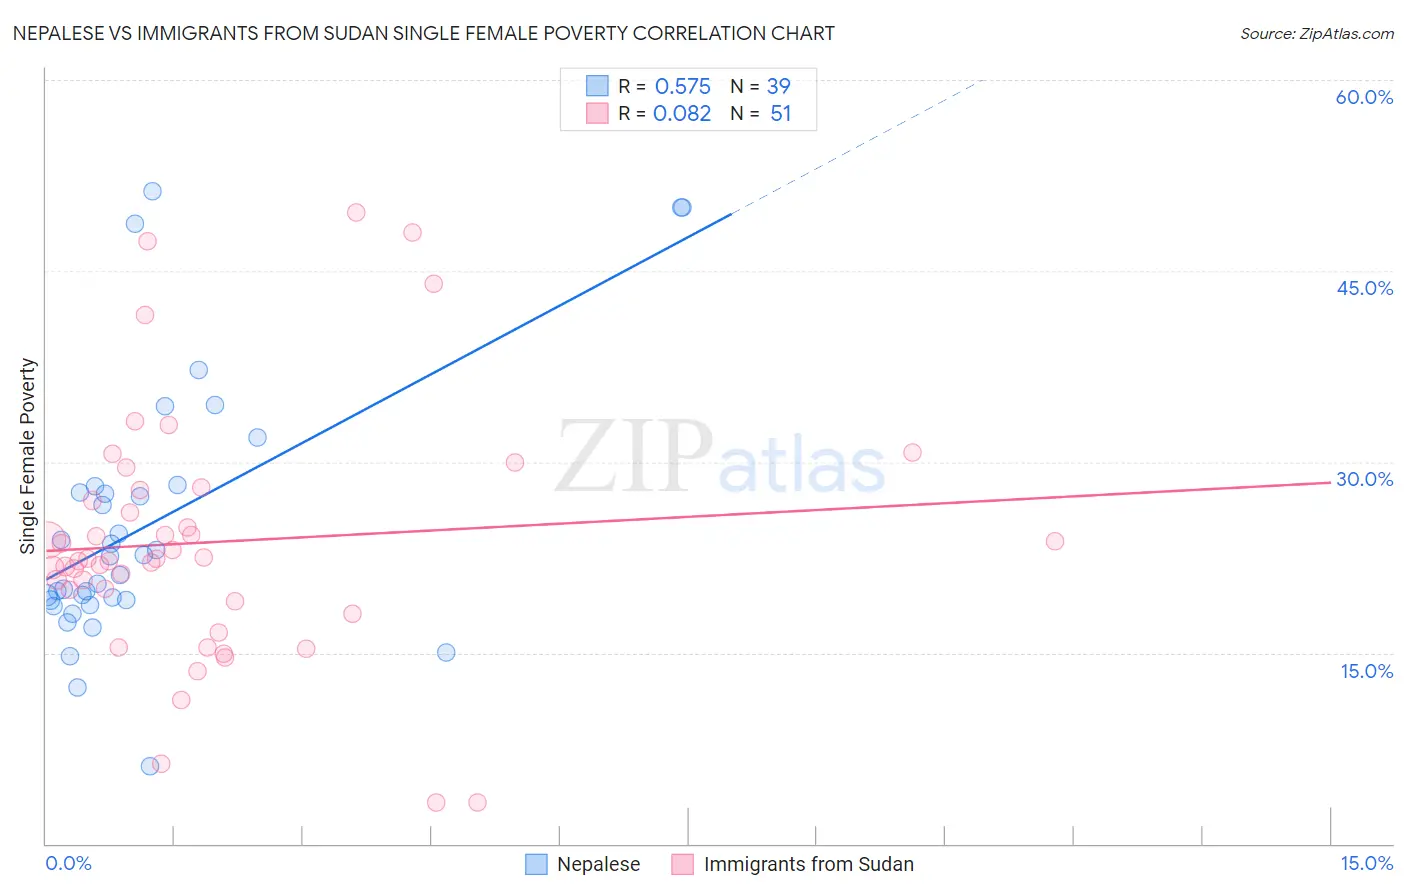
Nepalese vs Immigrants from Sudan Single Female Poverty Correlation Chart
The statistical analysis conducted on geographies consisting of 24,501,098 people shows a substantial positive correlation between the proportion of Nepalese and poverty level among single females in the United States with a correlation coefficient (R) of 0.575 and weighted average of 21.7%. Similarly, the statistical analysis conducted on geographies consisting of 118,406,629 people shows a slight positive correlation between the proportion of Immigrants from Sudan and poverty level among single females in the United States with a correlation coefficient (R) of 0.082 and weighted average of 22.6%, a difference of 3.8%.
Single Female Poverty Correlation Summary
| Measurement | Nepalese | Immigrants from Sudan |
| Minimum | 6.1% | 3.2% |
| Maximum | 51.2% | 49.6% |
| Range | 45.1% | 46.4% |
| Mean | 25.1% | 23.7% |
| Median | 22.6% | 22.4% |
| Interquartile 25% (IQ1) | 19.1% | 19.0% |
| Interquartile 75% (IQ3) | 28.1% | 27.8% |
| Interquartile Range (IQR) | 9.0% | 8.8% |
| Standard Deviation (Sample) | 10.5% | 9.9% |
| Standard Deviation (Population) | 10.4% | 9.8% |
Similar Demographics by Single Female Poverty
Demographics Similar to Nepalese by Single Female Poverty
In terms of single female poverty, the demographic groups most similar to Nepalese are Panamanian (21.7%, a difference of 0.050%), German (21.8%, a difference of 0.26%), Immigrants from Grenada (21.8%, a difference of 0.31%), Immigrants from St. Vincent and the Grenadines (21.7%, a difference of 0.32%), and Immigrants from Eritrea (21.8%, a difference of 0.33%).
| Demographics | Rating | Rank | Single Female Poverty |
| Icelanders | 14.0 /100 | #211 | Poor 21.6% |
| Jamaicans | 14.0 /100 | #212 | Poor 21.6% |
| Guamanians/Chamorros | 13.7 /100 | #213 | Poor 21.6% |
| Immigrants | Nicaragua | 13.3 /100 | #214 | Poor 21.6% |
| Ecuadorians | 12.3 /100 | #215 | Poor 21.6% |
| Immigrants | Barbados | 12.2 /100 | #216 | Poor 21.7% |
| Immigrants | St. Vincent and the Grenadines | 11.7 /100 | #217 | Poor 21.7% |
| Nepalese | 9.7 /100 | #218 | Tragic 21.7% |
| Panamanians | 9.4 /100 | #219 | Tragic 21.7% |
| Germans | 8.3 /100 | #220 | Tragic 21.8% |
| Immigrants | Grenada | 8.0 /100 | #221 | Tragic 21.8% |
| Immigrants | Eritrea | 7.9 /100 | #222 | Tragic 21.8% |
| Scottish | 7.3 /100 | #223 | Tragic 21.8% |
| Barbadians | 7.2 /100 | #224 | Tragic 21.8% |
| English | 6.4 /100 | #225 | Tragic 21.9% |
Demographics Similar to Immigrants from Sudan by Single Female Poverty
In terms of single female poverty, the demographic groups most similar to Immigrants from Sudan are Immigrants from Burma/Myanmar (22.6%, a difference of 0.0%), Immigrants from Liberia (22.5%, a difference of 0.10%), Immigrants from Belize (22.6%, a difference of 0.14%), Delaware (22.5%, a difference of 0.19%), and Sudanese (22.6%, a difference of 0.29%).
| Demographics | Rating | Rank | Single Female Poverty |
| Belizeans | 1.4 /100 | #248 | Tragic 22.4% |
| Immigrants | Caribbean | 1.3 /100 | #249 | Tragic 22.4% |
| Immigrants | Bahamas | 1.2 /100 | #250 | Tragic 22.5% |
| Immigrants | West Indies | 1.0 /100 | #251 | Tragic 22.5% |
| Delaware | 1.0 /100 | #252 | Tragic 22.5% |
| Immigrants | Liberia | 0.9 /100 | #253 | Tragic 22.5% |
| Immigrants | Burma/Myanmar | 0.8 /100 | #254 | Tragic 22.6% |
| Immigrants | Sudan | 0.8 /100 | #255 | Tragic 22.6% |
| Immigrants | Belize | 0.8 /100 | #256 | Tragic 22.6% |
| Sudanese | 0.7 /100 | #257 | Tragic 22.6% |
| Bahamians | 0.6 /100 | #258 | Tragic 22.7% |
| Whites/Caucasians | 0.6 /100 | #259 | Tragic 22.7% |
| Celtics | 0.5 /100 | #260 | Tragic 22.7% |
| Immigrants | Cabo Verde | 0.4 /100 | #261 | Tragic 22.8% |
| British West Indians | 0.4 /100 | #262 | Tragic 22.8% |