Belgian vs Immigrants from Sudan Single Female Poverty
COMPARE
Belgian
Immigrants from Sudan
Single Female Poverty
Single Female Poverty Comparison
Belgians
Immigrants from Sudan
21.5%
SINGLE FEMALE POVERTY
16.1/ 100
METRIC RATING
206th/ 347
METRIC RANK
22.6%
SINGLE FEMALE POVERTY
0.8/ 100
METRIC RATING
255th/ 347
METRIC RANK
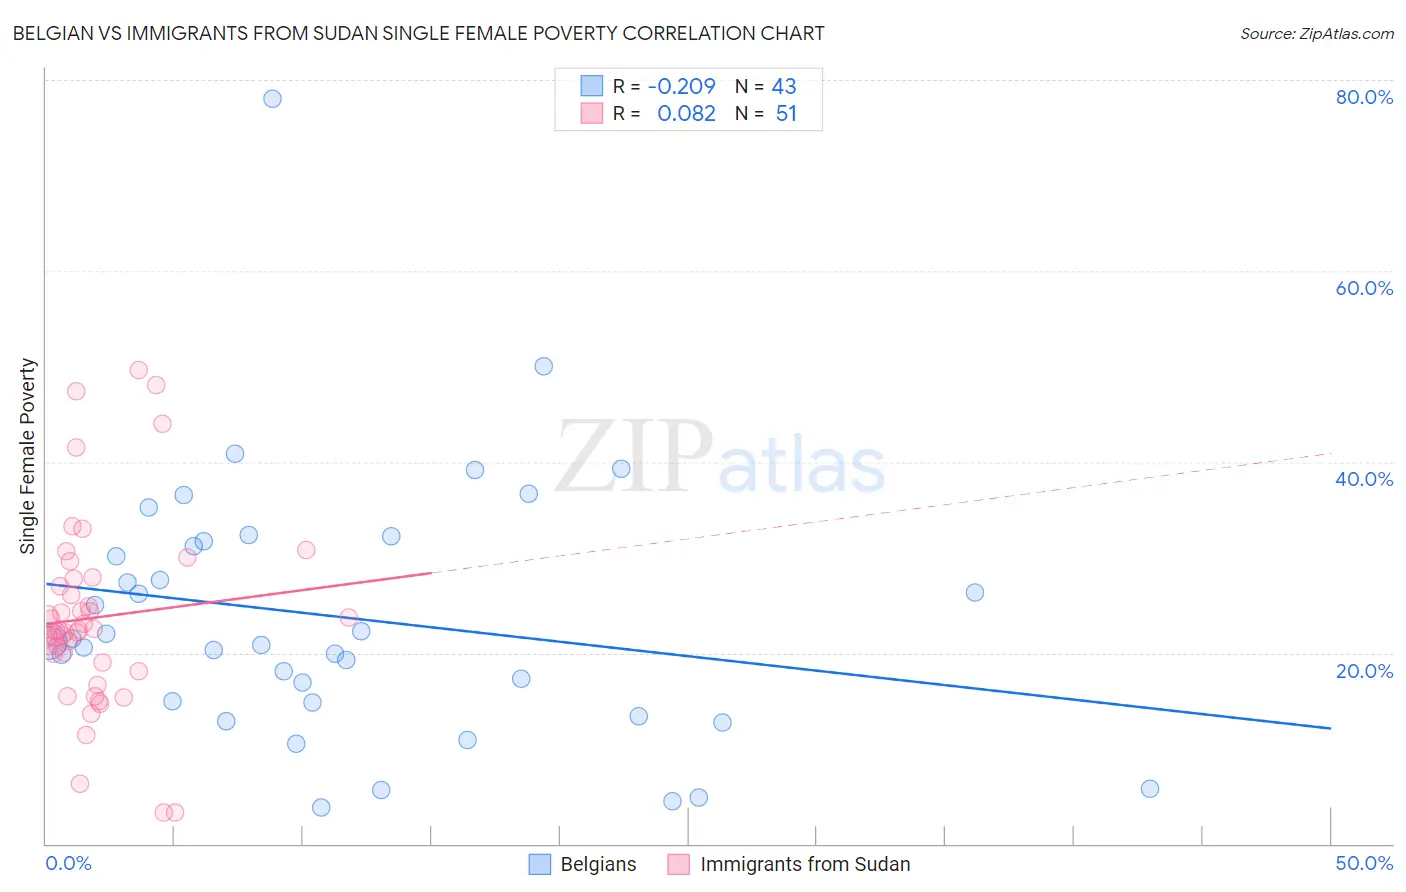
Belgian vs Immigrants from Sudan Single Female Poverty Correlation Chart
The statistical analysis conducted on geographies consisting of 349,903,575 people shows a weak negative correlation between the proportion of Belgians and poverty level among single females in the United States with a correlation coefficient (R) of -0.209 and weighted average of 21.5%. Similarly, the statistical analysis conducted on geographies consisting of 118,406,629 people shows a slight positive correlation between the proportion of Immigrants from Sudan and poverty level among single females in the United States with a correlation coefficient (R) of 0.082 and weighted average of 22.6%, a difference of 4.7%.
Single Female Poverty Correlation Summary
| Measurement | Belgian | Immigrants from Sudan |
| Minimum | 3.8% | 3.2% |
| Maximum | 78.0% | 49.6% |
| Range | 74.2% | 46.4% |
| Mean | 23.7% | 23.7% |
| Median | 21.2% | 22.4% |
| Interquartile 25% (IQ1) | 14.8% | 19.0% |
| Interquartile 75% (IQ3) | 31.6% | 27.8% |
| Interquartile Range (IQR) | 16.8% | 8.8% |
| Standard Deviation (Sample) | 13.9% | 9.9% |
| Standard Deviation (Population) | 13.7% | 9.8% |
Similar Demographics by Single Female Poverty
Demographics Similar to Belgians by Single Female Poverty
In terms of single female poverty, the demographic groups most similar to Belgians are Finnish (21.5%, a difference of 0.020%), Ghanaian (21.6%, a difference of 0.040%), Immigrants from Africa (21.5%, a difference of 0.070%), Haitian (21.6%, a difference of 0.070%), and Immigrants from Eastern Africa (21.6%, a difference of 0.11%).
| Demographics | Rating | Rank | Single Female Poverty |
| Immigrants | Immigrants | 22.0 /100 | #199 | Fair 21.4% |
| Irish | 21.4 /100 | #200 | Fair 21.4% |
| Nigerians | 20.9 /100 | #201 | Fair 21.4% |
| Immigrants | Kenya | 20.7 /100 | #202 | Fair 21.4% |
| Immigrants | Haiti | 18.8 /100 | #203 | Poor 21.5% |
| Immigrants | Africa | 16.7 /100 | #204 | Poor 21.5% |
| Finns | 16.2 /100 | #205 | Poor 21.5% |
| Belgians | 16.1 /100 | #206 | Poor 21.5% |
| Ghanaians | 15.7 /100 | #207 | Poor 21.6% |
| Haitians | 15.4 /100 | #208 | Poor 21.6% |
| Immigrants | Eastern Africa | 15.1 /100 | #209 | Poor 21.6% |
| Immigrants | Panama | 14.4 /100 | #210 | Poor 21.6% |
| Icelanders | 14.0 /100 | #211 | Poor 21.6% |
| Jamaicans | 14.0 /100 | #212 | Poor 21.6% |
| Guamanians/Chamorros | 13.7 /100 | #213 | Poor 21.6% |
Demographics Similar to Immigrants from Sudan by Single Female Poverty
In terms of single female poverty, the demographic groups most similar to Immigrants from Sudan are Immigrants from Burma/Myanmar (22.6%, a difference of 0.0%), Immigrants from Liberia (22.5%, a difference of 0.10%), Immigrants from Belize (22.6%, a difference of 0.14%), Delaware (22.5%, a difference of 0.19%), and Sudanese (22.6%, a difference of 0.29%).
| Demographics | Rating | Rank | Single Female Poverty |
| Belizeans | 1.4 /100 | #248 | Tragic 22.4% |
| Immigrants | Caribbean | 1.3 /100 | #249 | Tragic 22.4% |
| Immigrants | Bahamas | 1.2 /100 | #250 | Tragic 22.5% |
| Immigrants | West Indies | 1.0 /100 | #251 | Tragic 22.5% |
| Delaware | 1.0 /100 | #252 | Tragic 22.5% |
| Immigrants | Liberia | 0.9 /100 | #253 | Tragic 22.5% |
| Immigrants | Burma/Myanmar | 0.8 /100 | #254 | Tragic 22.6% |
| Immigrants | Sudan | 0.8 /100 | #255 | Tragic 22.6% |
| Immigrants | Belize | 0.8 /100 | #256 | Tragic 22.6% |
| Sudanese | 0.7 /100 | #257 | Tragic 22.6% |
| Bahamians | 0.6 /100 | #258 | Tragic 22.7% |
| Whites/Caucasians | 0.6 /100 | #259 | Tragic 22.7% |
| Celtics | 0.5 /100 | #260 | Tragic 22.7% |
| Immigrants | Cabo Verde | 0.4 /100 | #261 | Tragic 22.8% |
| British West Indians | 0.4 /100 | #262 | Tragic 22.8% |