Immigrants from Thailand vs Immigrants from Saudi Arabia Single Male Poverty
COMPARE
Immigrants from Thailand
Immigrants from Saudi Arabia
Single Male Poverty
Single Male Poverty Comparison
Immigrants from Thailand
Immigrants from Saudi Arabia
13.0%
SINGLE MALE POVERTY
26.6/ 100
METRIC RATING
191st/ 347
METRIC RANK
14.0%
SINGLE MALE POVERTY
0.1/ 100
METRIC RATING
270th/ 347
METRIC RANK
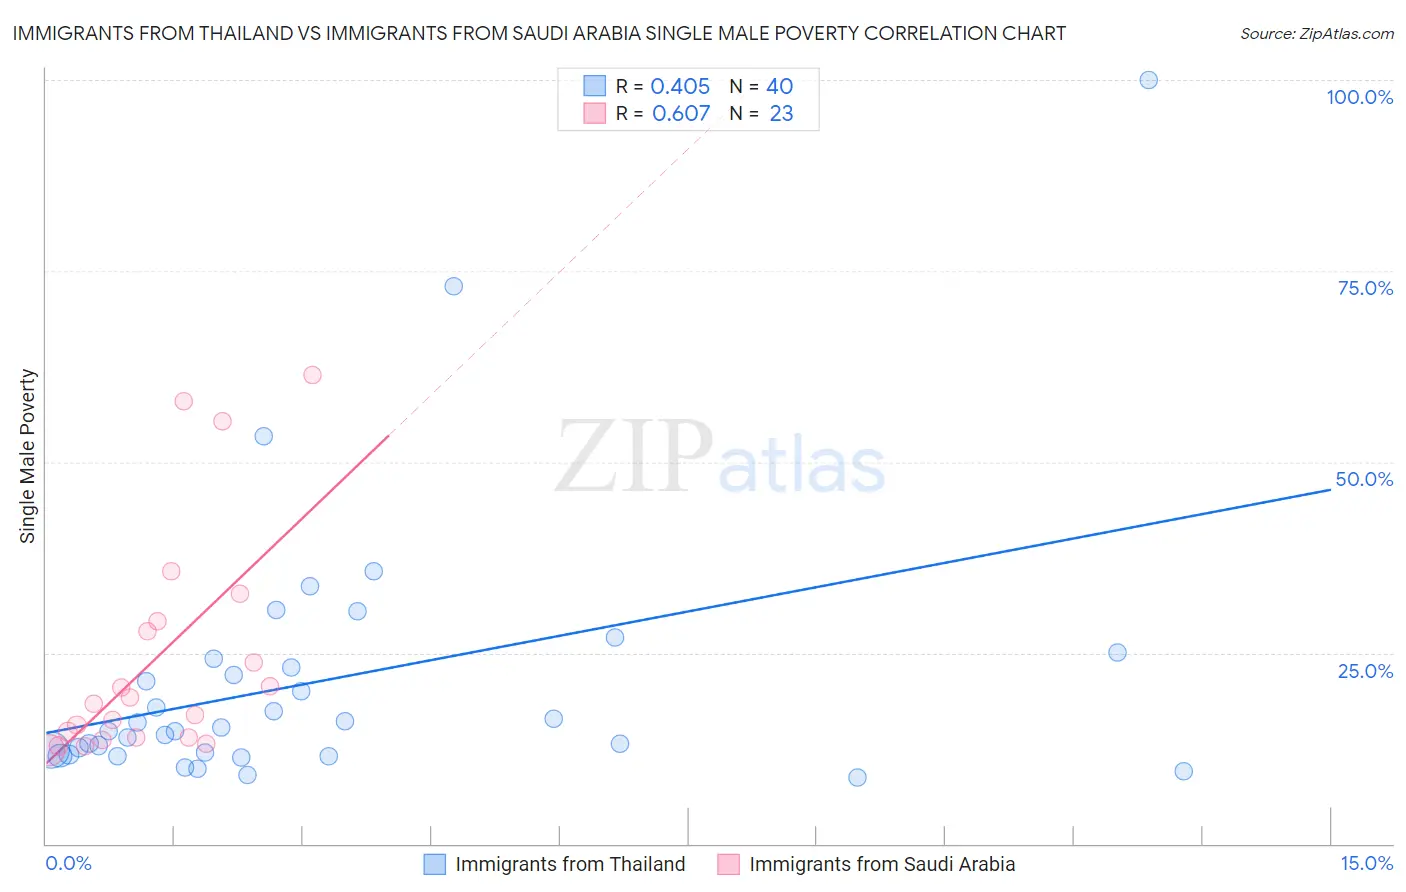
Immigrants from Thailand vs Immigrants from Saudi Arabia Single Male Poverty Correlation Chart
The statistical analysis conducted on geographies consisting of 289,372,326 people shows a moderate positive correlation between the proportion of Immigrants from Thailand and poverty level among single males in the United States with a correlation coefficient (R) of 0.405 and weighted average of 13.0%. Similarly, the statistical analysis conducted on geographies consisting of 155,832,907 people shows a significant positive correlation between the proportion of Immigrants from Saudi Arabia and poverty level among single males in the United States with a correlation coefficient (R) of 0.607 and weighted average of 14.0%, a difference of 7.7%.
Single Male Poverty Correlation Summary
| Measurement | Immigrants from Thailand | Immigrants from Saudi Arabia |
| Minimum | 8.7% | 12.2% |
| Maximum | 100.0% | 61.3% |
| Range | 91.3% | 49.1% |
| Mean | 21.4% | 24.3% |
| Median | 15.0% | 18.3% |
| Interquartile 25% (IQ1) | 11.8% | 13.9% |
| Interquartile 75% (IQ3) | 23.6% | 29.1% |
| Interquartile Range (IQR) | 11.8% | 15.3% |
| Standard Deviation (Sample) | 17.9% | 15.0% |
| Standard Deviation (Population) | 17.7% | 14.7% |
Similar Demographics by Single Male Poverty
Demographics Similar to Immigrants from Thailand by Single Male Poverty
In terms of single male poverty, the demographic groups most similar to Immigrants from Thailand are Immigrants from Jamaica (13.0%, a difference of 0.010%), Arab (13.0%, a difference of 0.030%), Immigrants from South Africa (13.0%, a difference of 0.030%), Liberian (13.0%, a difference of 0.090%), and Immigrants from England (13.0%, a difference of 0.22%).
| Demographics | Rating | Rank | Single Male Poverty |
| Immigrants | Trinidad and Tobago | 32.5 /100 | #184 | Fair 12.9% |
| Norwegians | 32.0 /100 | #185 | Fair 12.9% |
| Nigerians | 31.9 /100 | #186 | Fair 12.9% |
| Immigrants | Kuwait | 31.9 /100 | #187 | Fair 12.9% |
| Macedonians | 31.5 /100 | #188 | Fair 12.9% |
| Portuguese | 30.2 /100 | #189 | Fair 12.9% |
| Arabs | 27.0 /100 | #190 | Fair 13.0% |
| Immigrants | Thailand | 26.6 /100 | #191 | Fair 13.0% |
| Immigrants | Jamaica | 26.5 /100 | #192 | Fair 13.0% |
| Immigrants | South Africa | 26.1 /100 | #193 | Fair 13.0% |
| Liberians | 25.2 /100 | #194 | Fair 13.0% |
| Immigrants | England | 23.4 /100 | #195 | Fair 13.0% |
| Immigrants | Grenada | 23.1 /100 | #196 | Fair 13.0% |
| Immigrants | Laos | 23.1 /100 | #197 | Fair 13.0% |
| Lithuanians | 22.1 /100 | #198 | Fair 13.0% |
Demographics Similar to Immigrants from Saudi Arabia by Single Male Poverty
In terms of single male poverty, the demographic groups most similar to Immigrants from Saudi Arabia are Scottish (14.0%, a difference of 0.010%), Irish (14.0%, a difference of 0.030%), Mexican (14.0%, a difference of 0.090%), Immigrants from Mexico (13.9%, a difference of 0.17%), and German (13.9%, a difference of 0.23%).
| Demographics | Rating | Rank | Single Male Poverty |
| Cape Verdeans | 0.2 /100 | #263 | Tragic 13.8% |
| West Indians | 0.2 /100 | #264 | Tragic 13.8% |
| Immigrants | Congo | 0.2 /100 | #265 | Tragic 13.9% |
| Immigrants | Cabo Verde | 0.1 /100 | #266 | Tragic 13.9% |
| Germans | 0.1 /100 | #267 | Tragic 13.9% |
| Immigrants | Mexico | 0.1 /100 | #268 | Tragic 13.9% |
| Scottish | 0.1 /100 | #269 | Tragic 14.0% |
| Immigrants | Saudi Arabia | 0.1 /100 | #270 | Tragic 14.0% |
| Irish | 0.1 /100 | #271 | Tragic 14.0% |
| Mexicans | 0.1 /100 | #272 | Tragic 14.0% |
| Welsh | 0.1 /100 | #273 | Tragic 14.0% |
| Hondurans | 0.1 /100 | #274 | Tragic 14.0% |
| English | 0.1 /100 | #275 | Tragic 14.1% |
| Dutch | 0.1 /100 | #276 | Tragic 14.1% |
| Immigrants | Honduras | 0.0 /100 | #277 | Tragic 14.1% |