Bangladeshi vs Immigrants from Saudi Arabia Single Male Poverty
COMPARE
Bangladeshi
Immigrants from Saudi Arabia
Single Male Poverty
Single Male Poverty Comparison
Bangladeshis
Immigrants from Saudi Arabia
13.3%
SINGLE MALE POVERTY
3.7/ 100
METRIC RATING
235th/ 347
METRIC RANK
14.0%
SINGLE MALE POVERTY
0.1/ 100
METRIC RATING
270th/ 347
METRIC RANK
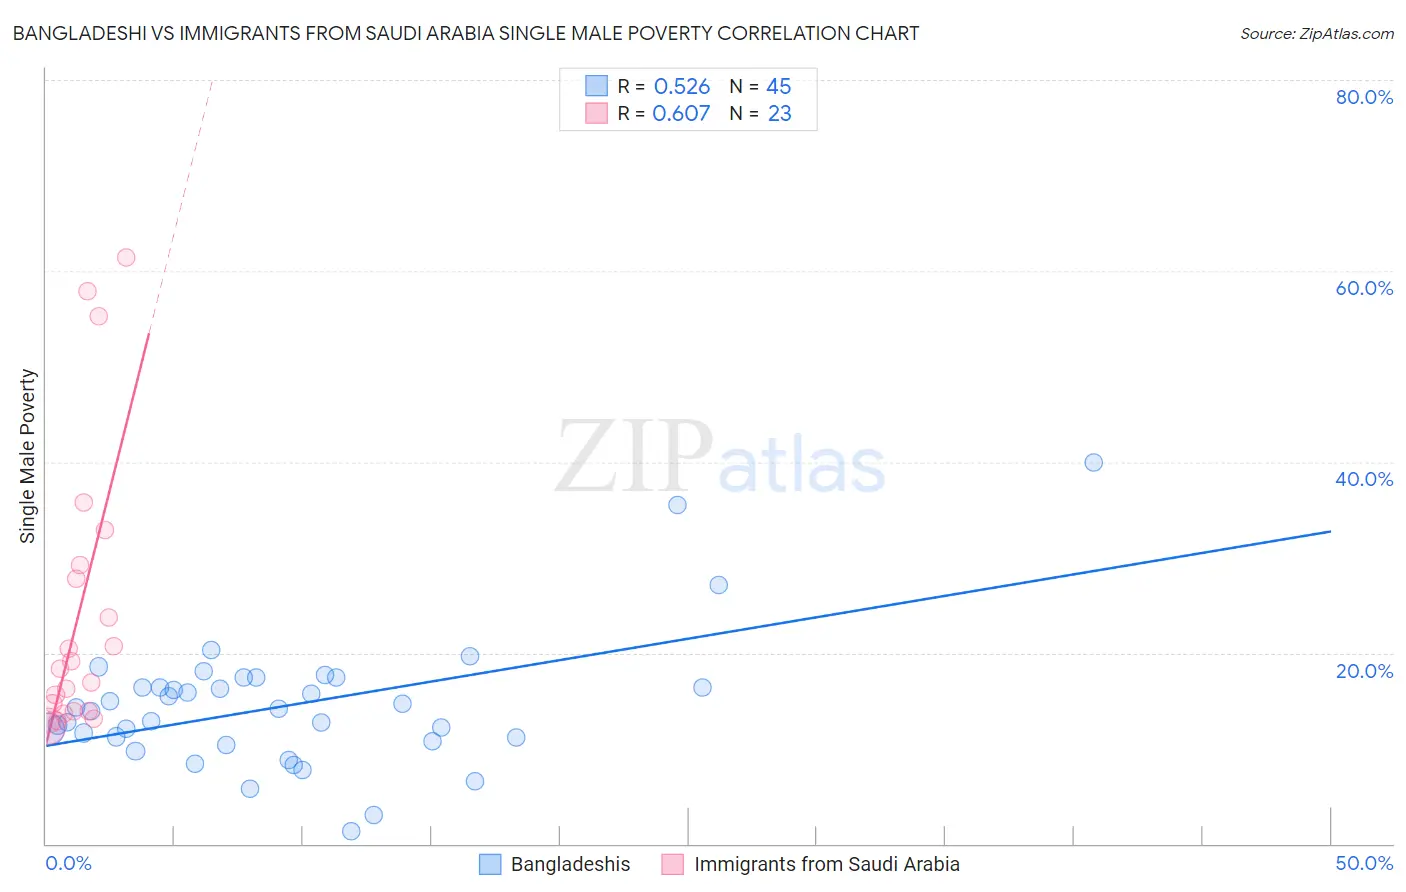
Bangladeshi vs Immigrants from Saudi Arabia Single Male Poverty Correlation Chart
The statistical analysis conducted on geographies consisting of 134,113,248 people shows a substantial positive correlation between the proportion of Bangladeshis and poverty level among single males in the United States with a correlation coefficient (R) of 0.526 and weighted average of 13.3%. Similarly, the statistical analysis conducted on geographies consisting of 155,832,907 people shows a significant positive correlation between the proportion of Immigrants from Saudi Arabia and poverty level among single males in the United States with a correlation coefficient (R) of 0.607 and weighted average of 14.0%, a difference of 4.7%.
Single Male Poverty Correlation Summary
| Measurement | Bangladeshi | Immigrants from Saudi Arabia |
| Minimum | 1.3% | 12.2% |
| Maximum | 40.0% | 61.3% |
| Range | 38.7% | 49.1% |
| Mean | 14.5% | 24.3% |
| Median | 14.1% | 18.3% |
| Interquartile 25% (IQ1) | 10.9% | 13.9% |
| Interquartile 75% (IQ3) | 16.9% | 29.1% |
| Interquartile Range (IQR) | 5.9% | 15.3% |
| Standard Deviation (Sample) | 6.9% | 15.0% |
| Standard Deviation (Population) | 6.8% | 14.7% |
Similar Demographics by Single Male Poverty
Demographics Similar to Bangladeshis by Single Male Poverty
In terms of single male poverty, the demographic groups most similar to Bangladeshis are Luxembourger (13.4%, a difference of 0.050%), British (13.3%, a difference of 0.10%), Canadian (13.3%, a difference of 0.10%), British West Indian (13.4%, a difference of 0.11%), and Immigrants from Ghana (13.4%, a difference of 0.21%).
| Demographics | Rating | Rank | Single Male Poverty |
| Lebanese | 6.6 /100 | #228 | Tragic 13.2% |
| Europeans | 6.2 /100 | #229 | Tragic 13.3% |
| Ghanaians | 6.1 /100 | #230 | Tragic 13.3% |
| Slavs | 5.3 /100 | #231 | Tragic 13.3% |
| Immigrants | Caribbean | 5.0 /100 | #232 | Tragic 13.3% |
| British | 4.0 /100 | #233 | Tragic 13.3% |
| Canadians | 4.0 /100 | #234 | Tragic 13.3% |
| Bangladeshis | 3.7 /100 | #235 | Tragic 13.3% |
| Luxembourgers | 3.6 /100 | #236 | Tragic 13.4% |
| British West Indians | 3.4 /100 | #237 | Tragic 13.4% |
| Immigrants | Ghana | 3.2 /100 | #238 | Tragic 13.4% |
| Czechoslovakians | 3.0 /100 | #239 | Tragic 13.4% |
| Belizeans | 2.3 /100 | #240 | Tragic 13.4% |
| Immigrants | Germany | 2.1 /100 | #241 | Tragic 13.4% |
| Carpatho Rusyns | 2.1 /100 | #242 | Tragic 13.4% |
Demographics Similar to Immigrants from Saudi Arabia by Single Male Poverty
In terms of single male poverty, the demographic groups most similar to Immigrants from Saudi Arabia are Scottish (14.0%, a difference of 0.010%), Irish (14.0%, a difference of 0.030%), Mexican (14.0%, a difference of 0.090%), Immigrants from Mexico (13.9%, a difference of 0.17%), and German (13.9%, a difference of 0.23%).
| Demographics | Rating | Rank | Single Male Poverty |
| Cape Verdeans | 0.2 /100 | #263 | Tragic 13.8% |
| West Indians | 0.2 /100 | #264 | Tragic 13.8% |
| Immigrants | Congo | 0.2 /100 | #265 | Tragic 13.9% |
| Immigrants | Cabo Verde | 0.1 /100 | #266 | Tragic 13.9% |
| Germans | 0.1 /100 | #267 | Tragic 13.9% |
| Immigrants | Mexico | 0.1 /100 | #268 | Tragic 13.9% |
| Scottish | 0.1 /100 | #269 | Tragic 14.0% |
| Immigrants | Saudi Arabia | 0.1 /100 | #270 | Tragic 14.0% |
| Irish | 0.1 /100 | #271 | Tragic 14.0% |
| Mexicans | 0.1 /100 | #272 | Tragic 14.0% |
| Welsh | 0.1 /100 | #273 | Tragic 14.0% |
| Hondurans | 0.1 /100 | #274 | Tragic 14.0% |
| English | 0.1 /100 | #275 | Tragic 14.1% |
| Dutch | 0.1 /100 | #276 | Tragic 14.1% |
| Immigrants | Honduras | 0.0 /100 | #277 | Tragic 14.1% |