Central American vs Immigrants from Saudi Arabia Single Male Poverty
COMPARE
Central American
Immigrants from Saudi Arabia
Single Male Poverty
Single Male Poverty Comparison
Central Americans
Immigrants from Saudi Arabia
13.2%
SINGLE MALE POVERTY
10.9/ 100
METRIC RATING
220th/ 347
METRIC RANK
14.0%
SINGLE MALE POVERTY
0.1/ 100
METRIC RATING
270th/ 347
METRIC RANK
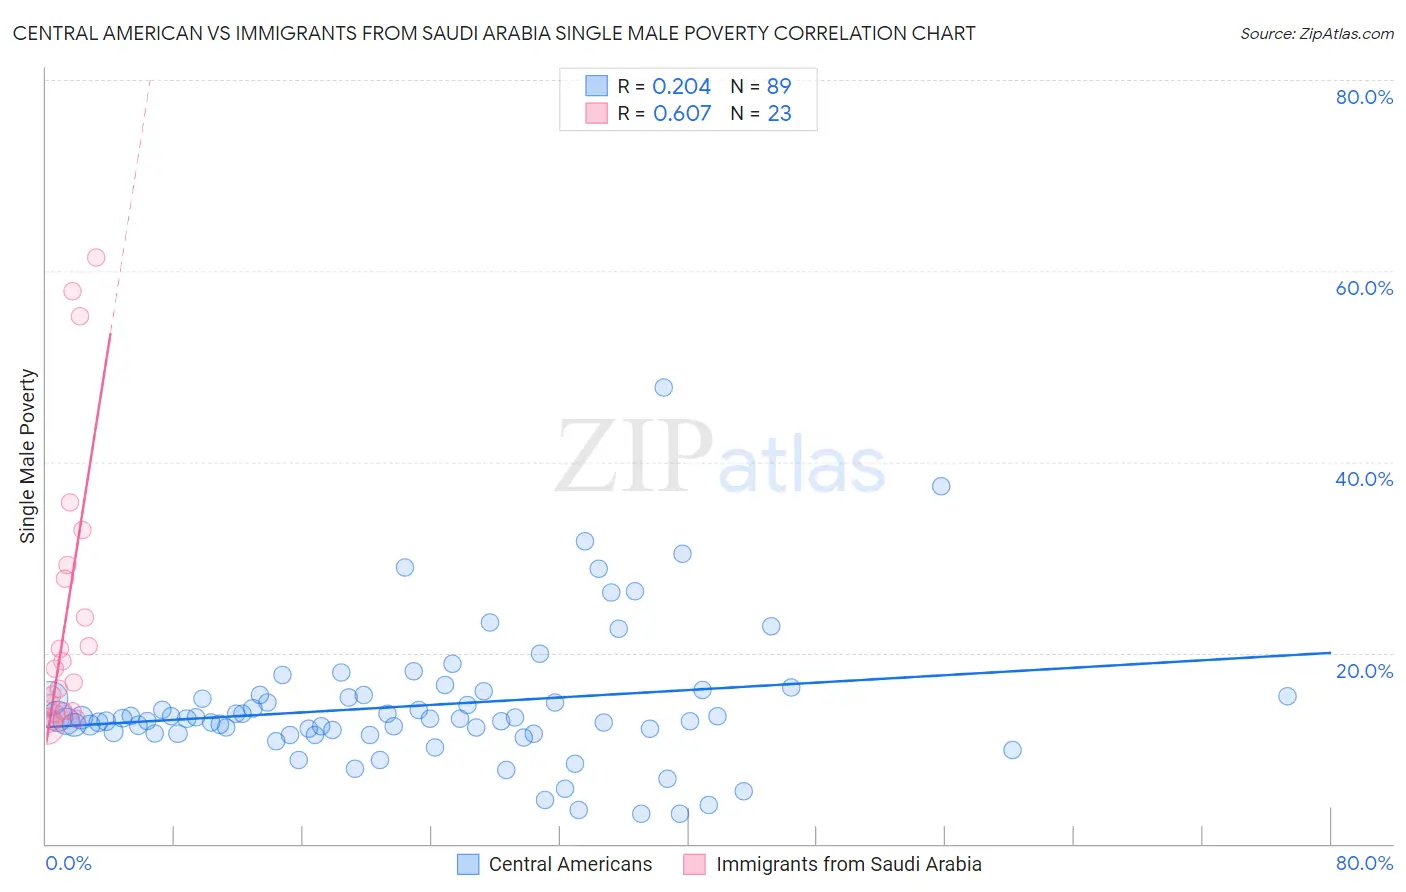
Central American vs Immigrants from Saudi Arabia Single Male Poverty Correlation Chart
The statistical analysis conducted on geographies consisting of 436,047,555 people shows a weak positive correlation between the proportion of Central Americans and poverty level among single males in the United States with a correlation coefficient (R) of 0.204 and weighted average of 13.2%. Similarly, the statistical analysis conducted on geographies consisting of 155,832,907 people shows a significant positive correlation between the proportion of Immigrants from Saudi Arabia and poverty level among single males in the United States with a correlation coefficient (R) of 0.607 and weighted average of 14.0%, a difference of 6.2%.
Single Male Poverty Correlation Summary
| Measurement | Central American | Immigrants from Saudi Arabia |
| Minimum | 3.1% | 12.2% |
| Maximum | 47.8% | 61.3% |
| Range | 44.7% | 49.1% |
| Mean | 14.5% | 24.3% |
| Median | 13.1% | 18.3% |
| Interquartile 25% (IQ1) | 11.5% | 13.9% |
| Interquartile 75% (IQ3) | 15.5% | 29.1% |
| Interquartile Range (IQR) | 4.0% | 15.3% |
| Standard Deviation (Sample) | 7.1% | 15.0% |
| Standard Deviation (Population) | 7.0% | 14.7% |
Similar Demographics by Single Male Poverty
Demographics Similar to Central Americans by Single Male Poverty
In terms of single male poverty, the demographic groups most similar to Central Americans are New Zealander (13.2%, a difference of 0.020%), Immigrants from Western Europe (13.2%, a difference of 0.11%), Immigrants from Burma/Myanmar (13.1%, a difference of 0.22%), Immigrants from the Azores (13.2%, a difference of 0.23%), and Scandinavian (13.1%, a difference of 0.25%).
| Demographics | Rating | Rank | Single Male Poverty |
| Italians | 15.9 /100 | #213 | Poor 13.1% |
| Zimbabweans | 14.9 /100 | #214 | Poor 13.1% |
| Japanese | 14.8 /100 | #215 | Poor 13.1% |
| Austrians | 13.9 /100 | #216 | Poor 13.1% |
| Bermudans | 13.0 /100 | #217 | Poor 13.1% |
| Scandinavians | 12.9 /100 | #218 | Poor 13.1% |
| Immigrants | Burma/Myanmar | 12.6 /100 | #219 | Poor 13.1% |
| Central Americans | 10.9 /100 | #220 | Poor 13.2% |
| New Zealanders | 10.7 /100 | #221 | Poor 13.2% |
| Immigrants | Western Europe | 10.0 /100 | #222 | Poor 13.2% |
| Immigrants | Azores | 9.3 /100 | #223 | Tragic 13.2% |
| Somalis | 9.1 /100 | #224 | Tragic 13.2% |
| Immigrants | Denmark | 8.7 /100 | #225 | Tragic 13.2% |
| Jamaicans | 7.7 /100 | #226 | Tragic 13.2% |
| Haitians | 7.0 /100 | #227 | Tragic 13.2% |
Demographics Similar to Immigrants from Saudi Arabia by Single Male Poverty
In terms of single male poverty, the demographic groups most similar to Immigrants from Saudi Arabia are Scottish (14.0%, a difference of 0.010%), Irish (14.0%, a difference of 0.030%), Mexican (14.0%, a difference of 0.090%), Immigrants from Mexico (13.9%, a difference of 0.17%), and German (13.9%, a difference of 0.23%).
| Demographics | Rating | Rank | Single Male Poverty |
| Cape Verdeans | 0.2 /100 | #263 | Tragic 13.8% |
| West Indians | 0.2 /100 | #264 | Tragic 13.8% |
| Immigrants | Congo | 0.2 /100 | #265 | Tragic 13.9% |
| Immigrants | Cabo Verde | 0.1 /100 | #266 | Tragic 13.9% |
| Germans | 0.1 /100 | #267 | Tragic 13.9% |
| Immigrants | Mexico | 0.1 /100 | #268 | Tragic 13.9% |
| Scottish | 0.1 /100 | #269 | Tragic 14.0% |
| Immigrants | Saudi Arabia | 0.1 /100 | #270 | Tragic 14.0% |
| Irish | 0.1 /100 | #271 | Tragic 14.0% |
| Mexicans | 0.1 /100 | #272 | Tragic 14.0% |
| Welsh | 0.1 /100 | #273 | Tragic 14.0% |
| Hondurans | 0.1 /100 | #274 | Tragic 14.0% |
| English | 0.1 /100 | #275 | Tragic 14.1% |
| Dutch | 0.1 /100 | #276 | Tragic 14.1% |
| Immigrants | Honduras | 0.0 /100 | #277 | Tragic 14.1% |