German Russian vs Syrian Divorced or Separated
COMPARE
German Russian
Syrian
Divorced or Separated
Divorced or Separated Comparison
German Russians
Syrians
12.0%
DIVORCED OR SEPARATED
61.8/ 100
METRIC RATING
165th/ 347
METRIC RANK
11.7%
DIVORCED OR SEPARATED
95.1/ 100
METRIC RATING
119th/ 347
METRIC RANK
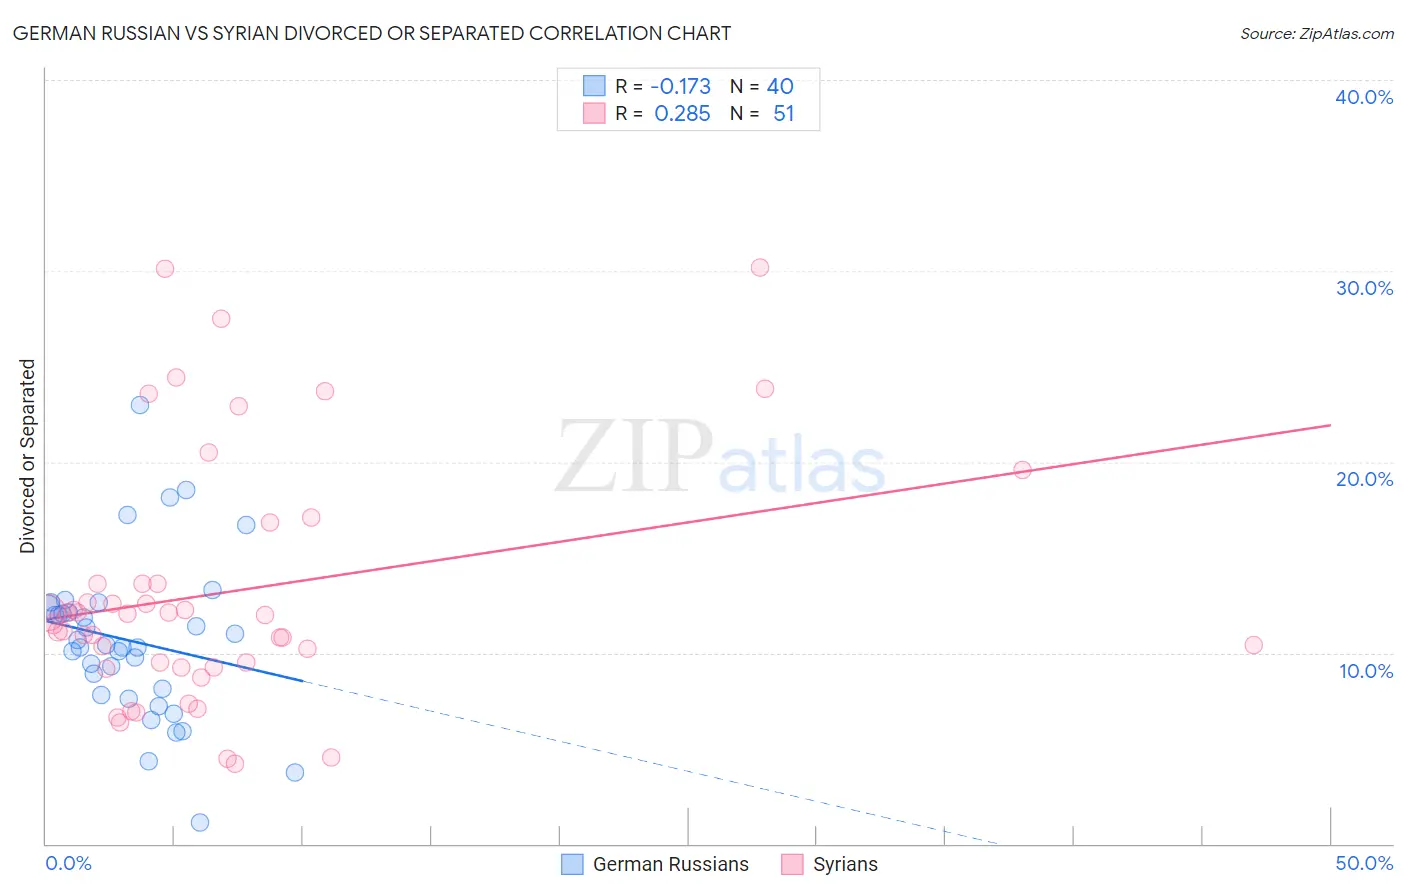
German Russian vs Syrian Divorced or Separated Correlation Chart
The statistical analysis conducted on geographies consisting of 96,447,174 people shows a poor negative correlation between the proportion of German Russians and percentage of population currently divorced or separated in the United States with a correlation coefficient (R) of -0.173 and weighted average of 12.0%. Similarly, the statistical analysis conducted on geographies consisting of 266,220,944 people shows a weak positive correlation between the proportion of Syrians and percentage of population currently divorced or separated in the United States with a correlation coefficient (R) of 0.285 and weighted average of 11.7%, a difference of 2.2%.
Divorced or Separated Correlation Summary
| Measurement | German Russian | Syrian |
| Minimum | 1.1% | 4.2% |
| Maximum | 23.0% | 30.2% |
| Range | 21.9% | 26.0% |
| Mean | 10.6% | 13.2% |
| Median | 10.4% | 12.0% |
| Interquartile 25% (IQ1) | 7.9% | 9.3% |
| Interquartile 75% (IQ3) | 12.3% | 13.6% |
| Interquartile Range (IQR) | 4.3% | 4.4% |
| Standard Deviation (Sample) | 4.2% | 6.5% |
| Standard Deviation (Population) | 4.1% | 6.4% |
Similar Demographics by Divorced or Separated
Demographics Similar to German Russians by Divorced or Separated
In terms of divorced or separated, the demographic groups most similar to German Russians are Tohono O'odham (12.0%, a difference of 0.050%), Swiss (12.0%, a difference of 0.070%), Navajo (12.0%, a difference of 0.080%), Samoan (12.0%, a difference of 0.090%), and Marshallese (12.0%, a difference of 0.11%).
| Demographics | Rating | Rank | Divorced or Separated |
| Icelanders | 66.0 /100 | #158 | Good 12.0% |
| Immigrants | Barbados | 66.0 /100 | #159 | Good 12.0% |
| Immigrants | Scotland | 65.8 /100 | #160 | Good 12.0% |
| Marshallese | 64.6 /100 | #161 | Good 12.0% |
| Samoans | 64.3 /100 | #162 | Good 12.0% |
| Navajo | 63.9 /100 | #163 | Good 12.0% |
| Swiss | 63.6 /100 | #164 | Good 12.0% |
| German Russians | 61.8 /100 | #165 | Good 12.0% |
| Tohono O'odham | 60.4 /100 | #166 | Good 12.0% |
| Ethiopians | 58.5 /100 | #167 | Average 12.0% |
| Serbians | 57.1 /100 | #168 | Average 12.0% |
| Immigrants | Peru | 57.0 /100 | #169 | Average 12.0% |
| Mexican American Indians | 55.8 /100 | #170 | Average 12.0% |
| Costa Ricans | 53.3 /100 | #171 | Average 12.0% |
| Immigrants | Mexico | 53.2 /100 | #172 | Average 12.0% |
Demographics Similar to Syrians by Divorced or Separated
In terms of divorced or separated, the demographic groups most similar to Syrians are Ecuadorian (11.7%, a difference of 0.040%), Immigrants from Uganda (11.7%, a difference of 0.050%), Immigrants from Iraq (11.7%, a difference of 0.060%), Iraqi (11.8%, a difference of 0.090%), and Romanian (11.8%, a difference of 0.10%).
| Demographics | Rating | Rank | Divorced or Separated |
| Immigrants | France | 96.6 /100 | #112 | Exceptional 11.7% |
| Estonians | 96.6 /100 | #113 | Exceptional 11.7% |
| Immigrants | Norway | 95.9 /100 | #114 | Exceptional 11.7% |
| Lithuanians | 95.7 /100 | #115 | Exceptional 11.7% |
| Immigrants | Iraq | 95.4 /100 | #116 | Exceptional 11.7% |
| Immigrants | Uganda | 95.3 /100 | #117 | Exceptional 11.7% |
| Ecuadorians | 95.3 /100 | #118 | Exceptional 11.7% |
| Syrians | 95.1 /100 | #119 | Exceptional 11.7% |
| Iraqis | 94.6 /100 | #120 | Exceptional 11.8% |
| Romanians | 94.5 /100 | #121 | Exceptional 11.8% |
| Menominee | 93.8 /100 | #122 | Exceptional 11.8% |
| Immigrants | Immigrants | 93.7 /100 | #123 | Exceptional 11.8% |
| Ugandans | 93.1 /100 | #124 | Exceptional 11.8% |
| Ukrainians | 92.3 /100 | #125 | Exceptional 11.8% |
| South American Indians | 92.1 /100 | #126 | Exceptional 11.8% |