Austrian vs Immigrants from Senegal Receiving Food Stamps
COMPARE
Austrian
Immigrants from Senegal
Receiving Food Stamps
Receiving Food Stamps Comparison
Austrians
Immigrants from Senegal
10.0%
RECEIVING FOOD STAMPS
98.6/ 100
METRIC RATING
82nd/ 347
METRIC RANK
15.3%
RECEIVING FOOD STAMPS
0.0/ 100
METRIC RATING
289th/ 347
METRIC RANK
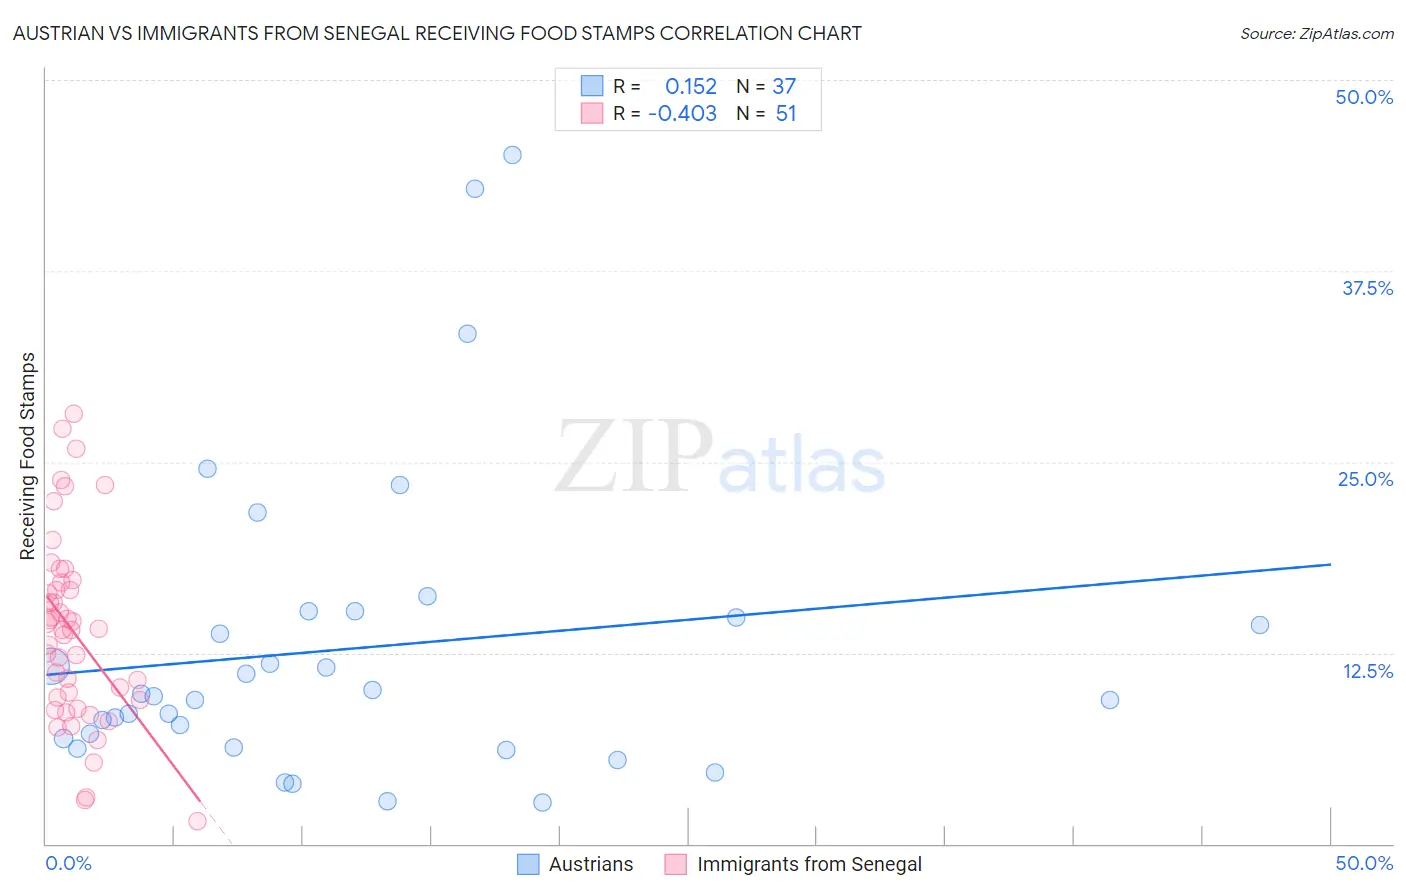
Austrian vs Immigrants from Senegal Receiving Food Stamps Correlation Chart
The statistical analysis conducted on geographies consisting of 450,225,937 people shows a poor positive correlation between the proportion of Austrians and percentage of population receiving government assistance and/or food stamps in the United States with a correlation coefficient (R) of 0.152 and weighted average of 10.0%. Similarly, the statistical analysis conducted on geographies consisting of 90,108,306 people shows a moderate negative correlation between the proportion of Immigrants from Senegal and percentage of population receiving government assistance and/or food stamps in the United States with a correlation coefficient (R) of -0.403 and weighted average of 15.3%, a difference of 53.4%.
Receiving Food Stamps Correlation Summary
| Measurement | Austrian | Immigrants from Senegal |
| Minimum | 2.7% | 1.5% |
| Maximum | 45.1% | 28.1% |
| Range | 42.4% | 26.6% |
| Mean | 12.8% | 13.9% |
| Median | 9.7% | 14.0% |
| Interquartile 25% (IQ1) | 6.6% | 9.4% |
| Interquartile 75% (IQ3) | 15.0% | 17.1% |
| Interquartile Range (IQR) | 8.4% | 7.7% |
| Standard Deviation (Sample) | 10.0% | 6.1% |
| Standard Deviation (Population) | 9.8% | 6.0% |
Similar Demographics by Receiving Food Stamps
Demographics Similar to Austrians by Receiving Food Stamps
In terms of receiving food stamps, the demographic groups most similar to Austrians are Dutch (10.0%, a difference of 0.0%), Immigrants from Israel (10.0%, a difference of 0.070%), Immigrants from England (10.0%, a difference of 0.13%), Immigrants from Romania (10.0%, a difference of 0.25%), and Polish (10.0%, a difference of 0.27%).
| Demographics | Rating | Rank | Receiving Food Stamps |
| Immigrants | Zimbabwe | 98.7 /100 | #75 | Exceptional 9.9% |
| Immigrants | Croatia | 98.7 /100 | #76 | Exceptional 10.0% |
| Immigrants | North Macedonia | 98.7 /100 | #77 | Exceptional 10.0% |
| South Africans | 98.7 /100 | #78 | Exceptional 10.0% |
| Laotians | 98.7 /100 | #79 | Exceptional 10.0% |
| Poles | 98.6 /100 | #80 | Exceptional 10.0% |
| Immigrants | England | 98.6 /100 | #81 | Exceptional 10.0% |
| Austrians | 98.6 /100 | #82 | Exceptional 10.0% |
| Dutch | 98.6 /100 | #83 | Exceptional 10.0% |
| Immigrants | Israel | 98.5 /100 | #84 | Exceptional 10.0% |
| Immigrants | Romania | 98.5 /100 | #85 | Exceptional 10.0% |
| Immigrants | Norway | 98.4 /100 | #86 | Exceptional 10.0% |
| Egyptians | 98.4 /100 | #87 | Exceptional 10.0% |
| Immigrants | Kuwait | 98.4 /100 | #88 | Exceptional 10.0% |
| Immigrants | France | 98.3 /100 | #89 | Exceptional 10.1% |
Demographics Similar to Immigrants from Senegal by Receiving Food Stamps
In terms of receiving food stamps, the demographic groups most similar to Immigrants from Senegal are Senegalese (15.4%, a difference of 0.27%), Immigrants from Belize (15.2%, a difference of 0.77%), Immigrants from Mexico (15.2%, a difference of 1.2%), Honduran (15.5%, a difference of 1.3%), and African (15.1%, a difference of 1.5%).
| Demographics | Rating | Rank | Receiving Food Stamps |
| Immigrants | Central America | 0.0 /100 | #282 | Tragic 15.0% |
| Bangladeshis | 0.0 /100 | #283 | Tragic 15.0% |
| Immigrants | Ecuador | 0.0 /100 | #284 | Tragic 15.0% |
| Immigrants | Liberia | 0.0 /100 | #285 | Tragic 15.1% |
| Africans | 0.0 /100 | #286 | Tragic 15.1% |
| Immigrants | Mexico | 0.0 /100 | #287 | Tragic 15.2% |
| Immigrants | Belize | 0.0 /100 | #288 | Tragic 15.2% |
| Immigrants | Senegal | 0.0 /100 | #289 | Tragic 15.3% |
| Senegalese | 0.0 /100 | #290 | Tragic 15.4% |
| Hondurans | 0.0 /100 | #291 | Tragic 15.5% |
| Alaska Natives | 0.0 /100 | #292 | Tragic 15.6% |
| Vietnamese | 0.0 /100 | #293 | Tragic 15.7% |
| Immigrants | Latin America | 0.0 /100 | #294 | Tragic 15.7% |
| Immigrants | Honduras | 0.0 /100 | #295 | Tragic 15.7% |
| Tsimshian | 0.0 /100 | #296 | Tragic 15.7% |